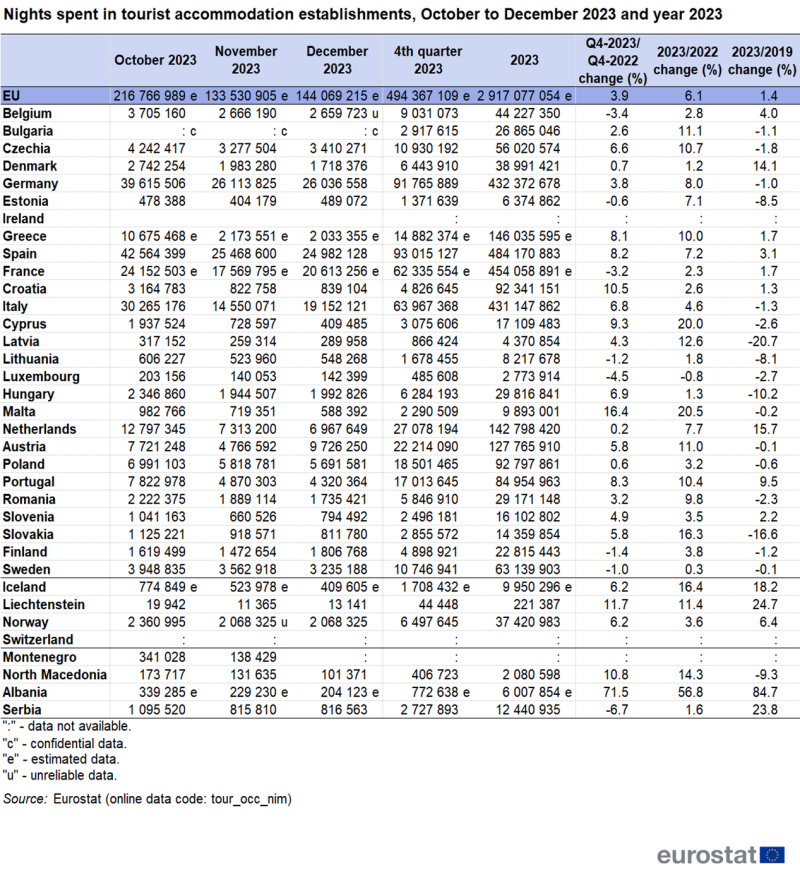
Nearly half a billion tourism nights spent in the last quarter of 2023
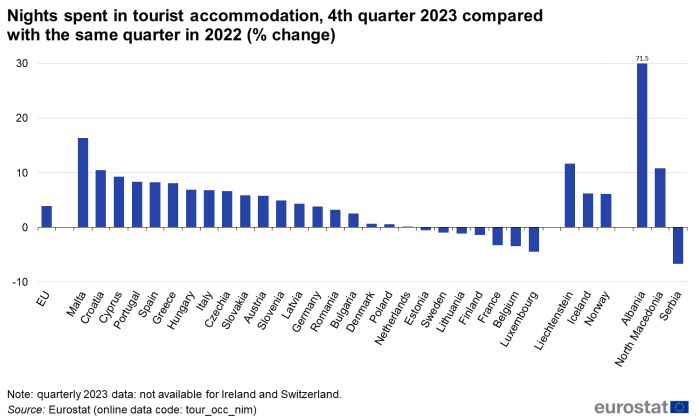
In the last three months of 2023, nearly half a billion nights were spent in EU tourist accommodation: 217 million nights in October, 134 million nights in November and 144 million nights in December (see Table 1). This corresponds to 19 million more nights (+3.9 %) than those spent in the last three months of 2022. Nineteen out of 26 EU countries with available data reported a positive trend. The highest increases in the last quarter of 2023 were recorded in Malta and Croatia, with +16.4 % and +10.5 % respectively (see Figure 1). More than half of the 494 million nights spent in the EU in the fourth quarter were observed in the top-3 countries Spain (93 million nights ), Germany (92 million) and Italy (64 million), France followed closely with 62 million nights spent.
Source: Eurostat (tour_occ_nim)
Source: Eurostat (tour_occ_nim)
Nights spent at tourist accommodation approaching 3 billion in 2023
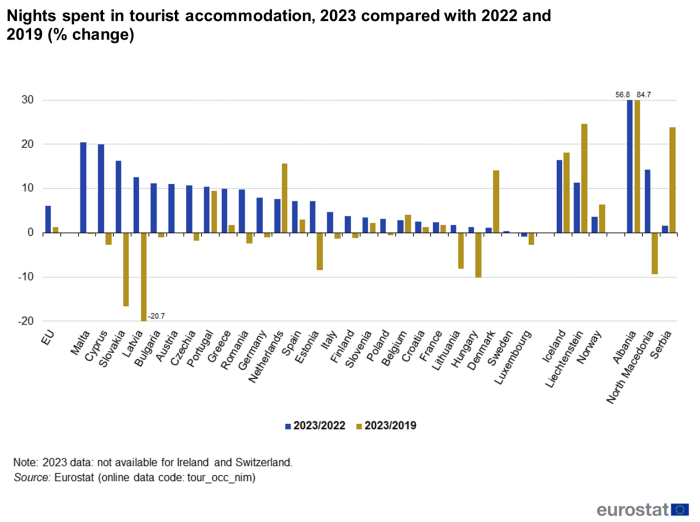
With the release of December 2023 data, estimates for the entire year of 2023 are now available. The year 2023 marked a return to pre-pandemic tourism volumes, with 2.92 billion nights spent in EU tourist accommodation (see Table 1). This marks an increase by 1.4 % compared with the volume of nights spent in 2019, and an increase by 6.1 % compared with the year 2022. In 25 out of 26 EU countries for which annual data is now available, the nights spent in 2023 exceeded the 2022 level, only in Luxembourg was a small decrease (-0.8 %) observed. Nine countries recorded double-digit growth rates which exceeded 20 % in Malta and Cyprus (see Figure 2). The apparent recovery from the pandemic at EU aggregate level, with figures exceeding those from 2019 by 39 million nights spent (+1.4 %), hides a very heterogenous situation across the Union with 17 countries still below the 2019 levels and 9 countries above the 2019 levels. While the Netherlands (+19 million nights), Spain (+14 million), France (+8 million) and Portugal (+7 million) saw big increases in absolute terms compared with the year 2019, other countries still saw tourism volumes deeply below the 2019 levels, notably Italy (-6 million), Germany (-5 million) and Hungary and Slovakia (both -3 million). In relative terms, the latter country (-16.6 %) and Latvia (-20.7 %) were still furthest away from their pre-pandemic tourism volumes.
Source: Eurostat (tour_occ_nim)
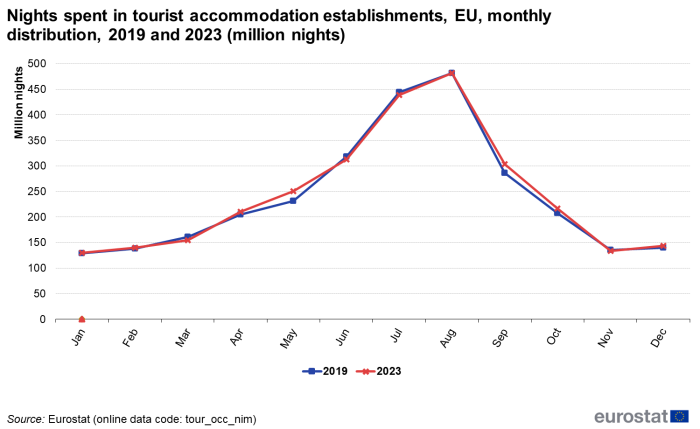
Looking at the monthly distribution of the nights spent (see Figure 3), the seasonal pattern in 2023 was similar to that of four years earlier. The dominance of July and August was a little bit less pronounced (31.6 % of all annual nights in 2023 compared with 32.2 % in 2019), while shoulder months May and September took a slightly bigger share of the annual nights (19.0 % in 2023, compared with 18.0 % in 2019).
Source: Eurostat (tour_occ_nim)
International tourism was the biggest contributor to the growth in 2023
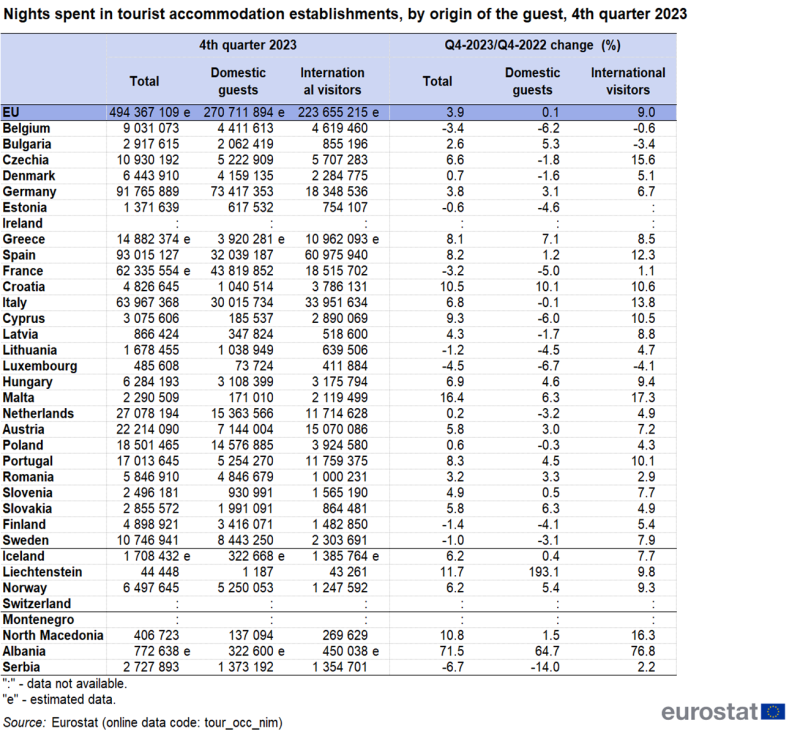
The breakdown by origin of the guest (see Table 2) shows that in the fourth quarter of 2023 compared with the fourth quarter of 2022, the overall increase by 18.7 million nights spent (+3.9 %) was mainly created in the segment of international tourism (+9.0 %). This segment accounted almost the entirety of the overall increase (+18.5 million, compared with +0.2 million nights extra in the domestic segment). In absolute terms, the biggest increases in international nights spent in the fourth quarter were observed in Spain (+6.7 million) and Italy (+4.1 million). In relative terms, Malta (+17.3 %), Czechia (+15.6 %) and Italy (+13.8 %) recorded the highest growth in nights spent by foreigners in the fourth quarter. Croatia showed the highest growth rate in the number of domestic nights spent (+10.1%) but in absolute terms the biggest increase was noted in Germany (+2.2 million domestic nights), somehow offset by a similarly big decrease of domestic nights in France (-2.3 million, or -5.0 % compared with the fourth quarter of 2022).
Source: Eurostat (tour_occ_nim)
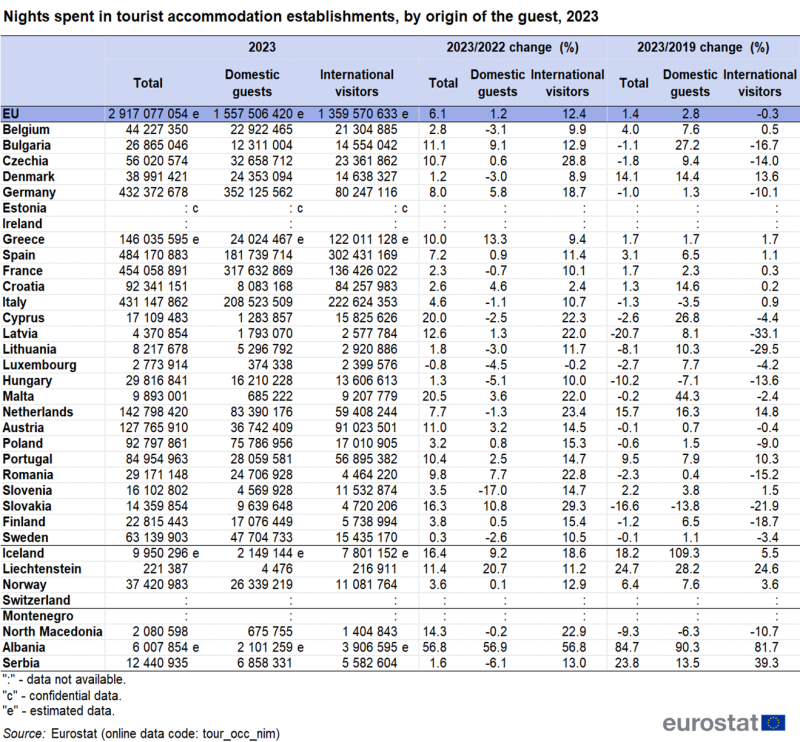
The important contribution of the international tourism flows to the overall growth observed in the fourth quarter of 2023, can be extended to the results for the entire year, with international tourism accounting for 89 % of the growth in nights spent. Last year, the number of nights spent increased with 168.6 million, of which 150.3 million extra nights by international visitors (+12.4 %) and 18.3 million extra nights by domestic guests (+1.2 %) (see Table 3). The biggest increase in international nights was in Spain (+31.0 million nights, +11,4 %), the biggest increase in domestic nights was in Germany (+19.3 million, +5.8 %). In percentage change, the highest growth in international tourism was observed in Slovakia and Czechia (both +29 %). In volume, domestic tourism remained the dominant segment, accounting for 1.56 billion nights spent (53.4 % of the total 2.92 million nights spent in 2023).
Source: Eurostat (tour_occ_nim)
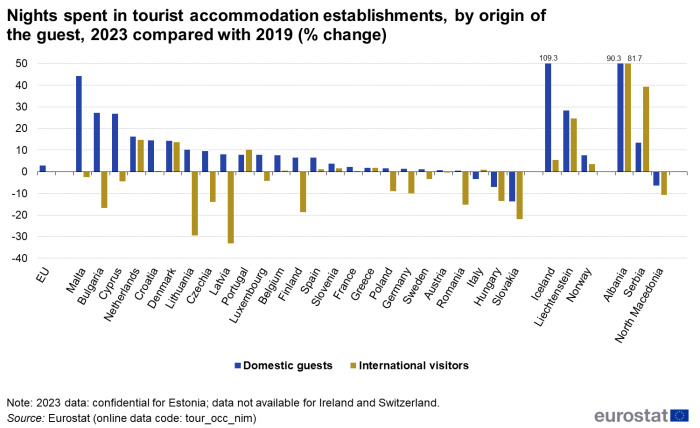
The impressive path of the international tourism flows in the course of 2023 didn’t fully fill the gap with the pre-pandemic level of 2019. With 1.36 billion nights spent in 2023, international tourism was still 3.4 million nights below the level of 2019 (-0.3 %). On the other hand, domestic tourism reached a record number, exceeding the 2019 level by 2.8 %. In all but three of the 25 EU countries for which data is available, domestic tourism nights outnumbered the level of the domestic nights in 2019 (see Figure 4). For international tourism, the picture is more mixed with international visitor numbers still below the 2019 level in more than half of the EU countries.
Source: Eurostat (tour_occ_ninat) (tour_occ_nim)
Hotels accounted for nearly two thirds of nights spent in 2023
Traditionally, the camping segment is relatively unimportant in the fourth quarter (3.7 % of all nights spent, with the majority recorded in October 2023). Hotels and similar accommodation accounted for 74.0 % of the nights spent in the fourth quarter, the remaining 22.3 % was taken by holiday and other-short stay accommodation.
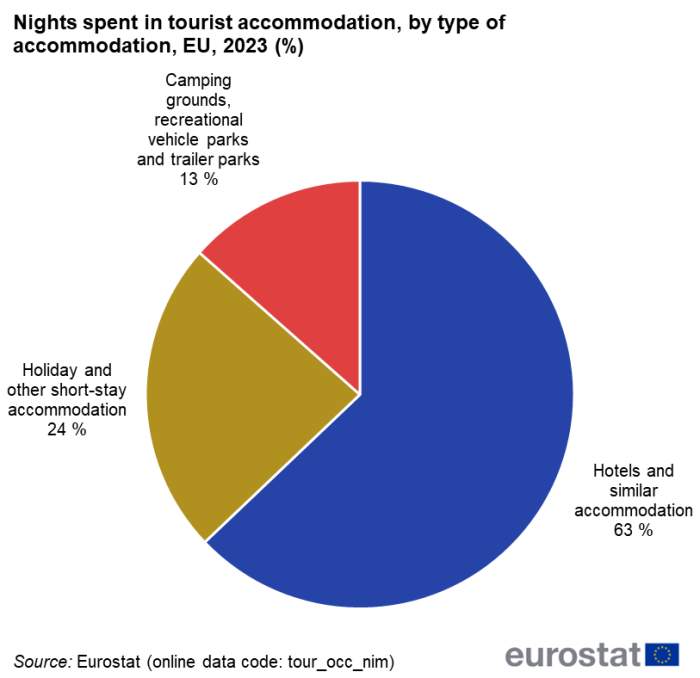
At annual level, the dominance of the hotels segment was a bit less pronounced, with a share of 62.9 % in the total nights spent at tourist accommodation establishments in the EU (see Figure 5). Holiday and short-stay accommodation and campsites accounted for 23.6 % and 13.5 % of the market respectively.
Source: Eurostat (tour_occ_nim)
Data on tourism nights is included in the interactive European Statistical Recovery Dashboard, which contains monthly and quarterly indicators from a number of statistical areas relevant for tracking the economic and social recovery from the Covid-19 pandemic, across countries and time. The dashboard is updated every month with the latest available data for each indicator.
Source data for tables and graphs
Data sources
This article presents the short-term trends in nights spent in tourist accommodation in the EU, analysing monthly data provided by Member States.
For the year-to-year evolution of the number of nights spent in tourist accommodation and a detailed analysis of 2022 annual data, see Tourism statistics – annual results for the accommodation sector.
Context
The EU is a major tourist destination, with four Member States among the world’s top ten destinations for holidaymakers, according to UNWTO[1] data. Tourism is an important activity in the EU which contributes to employment and economic growth, as well as to the development of rural, peripheral or less-developed areas. These characteristics drive the demand for reliable and harmonised statistics on this activity, as well as within the wider context of regional policy and sustainable development policy areas.

