Education
One of the prominent indicators in education statistics is the proportion of persons who have attained tertiary education (i.e. who graduated from universities or other higher education institutions).
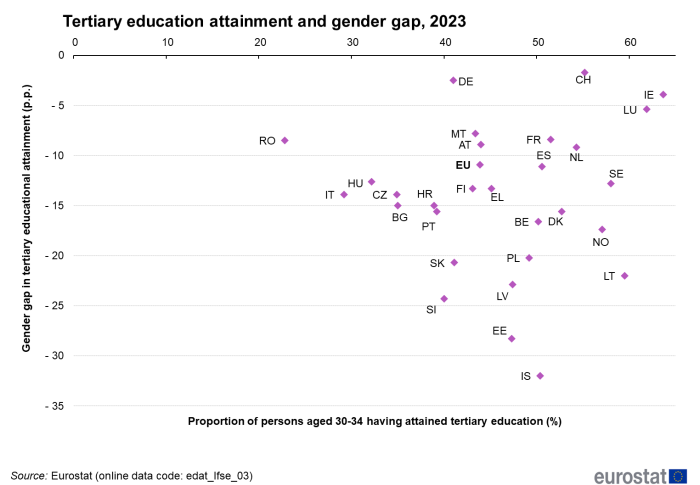
From the ‘tertiary education attainment’ indicator, a gender gap can be derived. It is defined as the proportion of men aged 30-34 years that have attained tertiary education minus that of women. In 2023, this gender gap was -10.9 percentage points (pp) in the EU, meaning that the proportion of women aged 30-34 years that had attained tertiary education exceeded that of men by 10.9 pp (see Figure 1). All EU Member States recorded a negative gender gap in tertiary education attainment. In 2023, that gap ranged from -2.5 pp in Germany (the smallest gender gap in absolute value), -3.9 pp in Ireland and -5.4 pp in Luxembourg to -22.0 pp in Lithuania, -22.9 pp in Latvia, -24.3 pp in Slovenia and -28.3 pp in Estonia (the largest gender gap in absolute value).
For the population as a whole, the proportion of persons aged 30-34 years that had attained tertiary education in 2023 ranged from 22.8 % in Romania to 66.1 % in Cyprus. Among the EU Member States with the largest gender gap in absolute value (above or equal to 22 pp), the proportion of persons with tertiary education was below the EU average (43.2 %) in Slovenia (40.0 %), Slovakia (41.1 %) and above in Estonia (47.3 %), Latvia (47.4 %) and Lithuania (59.5 %). Among the countries with the smallest gender gap in absolute value (below 6 pp), the proportion of persons aged 30-34 years with tertiary education was below the EU average, in Germany (41.0 %), whereas it was higher in Ireland (63.7 %) and Luxembourg (61.9 %).
For a better view of gender issues in the field of education, it is useful to take other indicators into account: upper secondary education attainment, lower secondary education, tertiary education graduates (women per 100 men), early leavers from education and training, as well as life-long-learning (see articles in Statistics Explained in the category Education and training).
Labour market
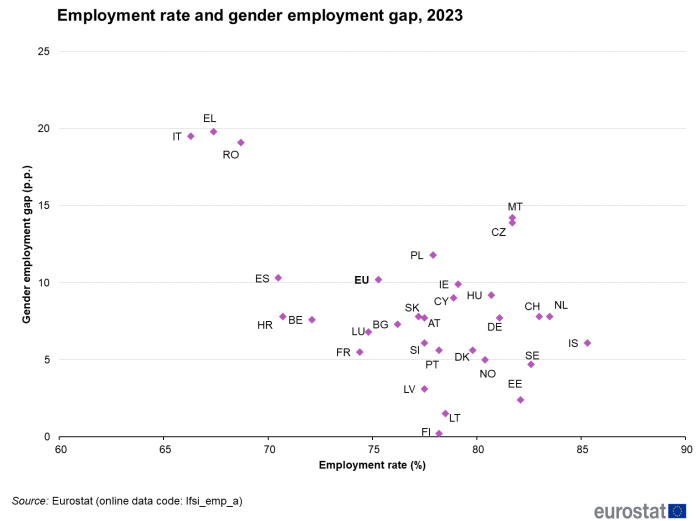
The employment rate is considered a key social indicator for analytical purposes when studying developments in labour markets. The gender gap analysed here is defined as the difference between the employment rates of men and women of working age (20-64 years). Across the EU, the gender employment gap was 10.2 pp in 2023, meaning that the proportion of men of working age in employment exceeded that of women by 10.2 pp (see Figure 2).
The gender employment gap varies significantly across EU Member States. In 2023, the lowest gap was reported in Finland (0.2 pp), followed by Lithuania (1.5 pp), Estonia (2.4 pp) and Latvia (3.1 pp). At the other end of the scale, Member States with the highest gaps were Romania (19.1 pp), Italy (19.5 pp) and Greece (19.8 pp). This is due to the lower participation of women in the labour market in these countries.
For the population as a whole, the employment rate of persons aged 20-64 years in 2023 ranged from 66.3 % (in Italy) to 83.5 % (in the Netherlands). Among all the EU Member States with the smallest gender employment gaps (below 5 pp), all had an employment rate above the EU average rate of 75.3 %. Conversely, in all three countries with the largest gender employment gaps, the employment rate was below the EU average: Italy (66.3 %), Greece (67.4 %) and Romania (68.7 %).
For a better view of the gender issues in the field of employment, it is useful to analyse the following indicators: employment rate by highest level of education attained, employment by economic activity, self-employment, part-time employment, temporary employees, as well as unemployment and long-term unemployment (see articles in Statistics Explained in the category Labour market).
Earnings
The ‘unadjusted’ gender pay gap provides an overall picture of gender inequality in hourly pay. This gap represents the difference between the average gross hourly earnings of men and women expressed as a percentage of average gross hourly earnings of men. It is called ‘unadjusted’ as it does not take into account all of the factors that influence the gender pay gap, such as differences in education, labour market experience or type of job.
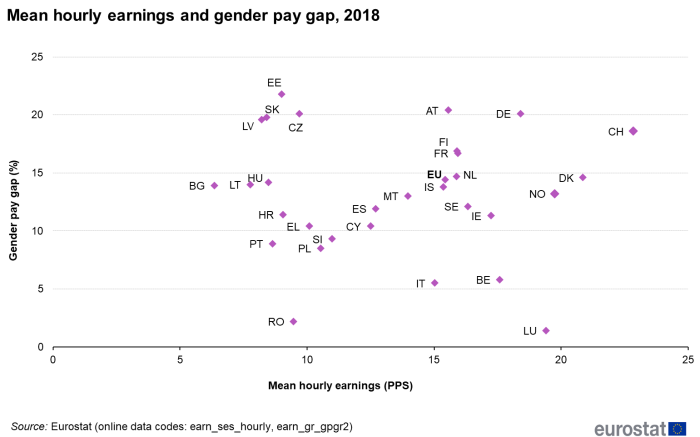
Across the EU, women earn less per hour than men do overall. For the economy as a whole, in 2018, women’s gross hourly earnings were on average 14.4 % below those of men in the EU. The gender pay gap varies significantly across Member States. In 2018, the gender pay gap ranged from 1.4 % in Luxembourg, 2.2 % in Romania, 5.5 % in Italy and 5.8 % in Belgium, to 20.1 % in both Czechia and Germany, 20.4 % in Austria and 21.8 % in Estonia. This section on earnings uses data from the last 4-yearly collection of the Structure of Earnings Survey of 2018. 2022 data on the gender pay gap are available in the following article Gender pay gap statistics.
Across Member States, employees’ average gross hourly earnings in 2018, expressed in purchasing power standards (PPS), varied from 6.4 PPS in Bulgaria to 20.9 PPS in Denmark. Among the countries with the smallest gender pay gap (below 10 %), earnings varied from 8.6 PPS in Portugal to 19.4 PPS in Luxembourg. The countries with the largest gender pay gap (above 20 %) recorded earnings ranging from 9.0 PPS in Estonia to 18.4 PPS in Germany.
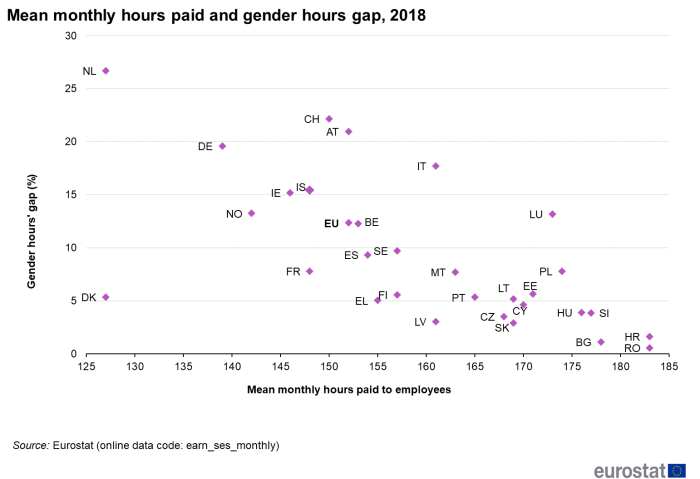
Besides the gender pay gap, based on hourly earnings, the difference between the average annual earnings of women versus men is also influenced by the higher proportion of part-time employees among women. This is shown by the ‘gender hours gap’ which represents the difference between average monthly hours paid to men and women expressed as a percentage of average hours paid to men.
In 2018, across the EU, women were paid on average for 12 % fewer hours than men per month (see Figure 4). The number of hours paid to men is broadly similar across EU countries, whereas part-time arrangements for women differ substantially. For the Netherlands, the gender hours gap stands out at 27 %, meaning that female employees are paid on average for 27 % fewer hours per month than men. At the other end of the scale, Romania and Bulgaria recorded a gender hours gap that was only 1 %.
Besides the gender pay gap and the gender hours gap, it is also useful to consider gender gaps in employment, as these also contribute to the difference in average earnings of women versus men[1]. To give a complete picture of the gender earnings gap, a new synthetic indicator has been developed. This measures the impact of the three combined factors, namely: (1) the average hourly earnings, (2) the monthly average of the number of hours paid (before any adjustment for part-time work) and (3) the employment rate, on the average earnings of all women of working age — whether employed or not employed — compared with men.
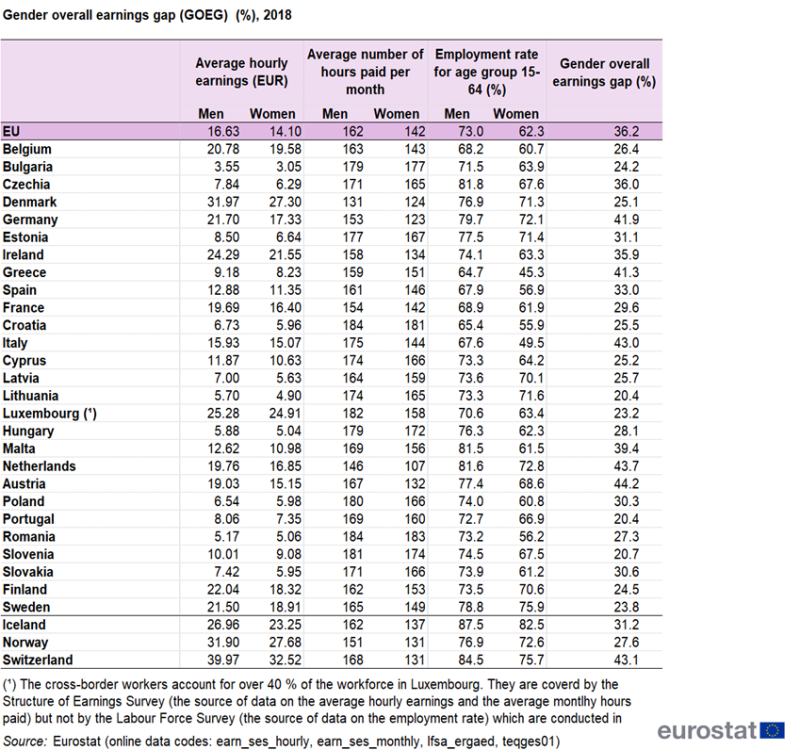
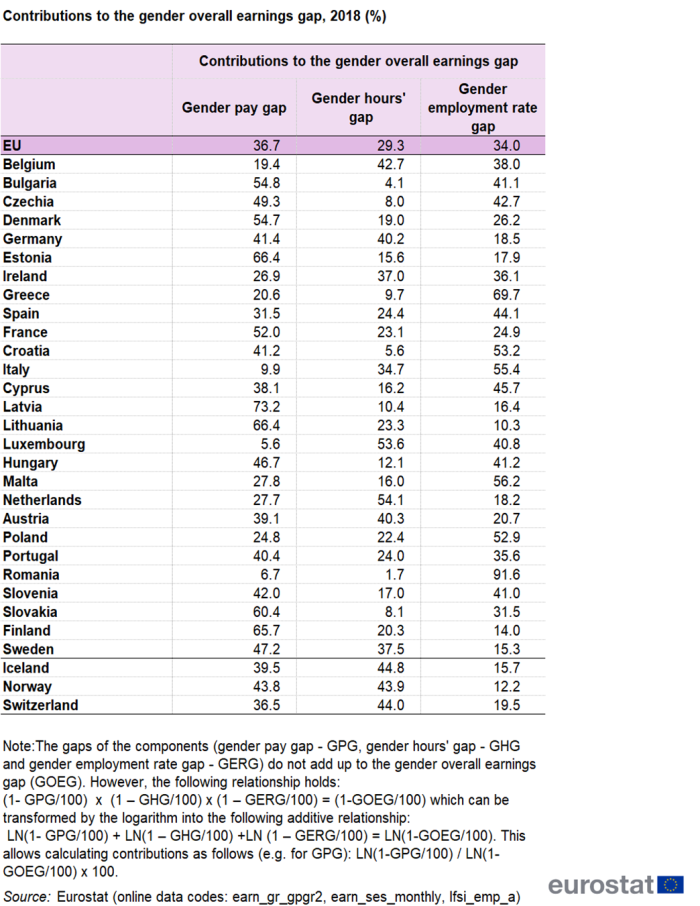
In 2018, the gender overall earnings gap was 36.2 % in the EU (see Table 1). Across Member States, the gender overall earnings gap varied significantly, from 20.4 % in Lithuania and Portugal to 44.2 % in Austria (see Figure 5). Countries that recorded a gender overall earnings gap lower than 30 % were: Lithuania (20.4 %), Portugal (20.4 %), Slovenia (20.7 %), Luxembourg (23.2 %), Sweden (23.8 %), Bulgaria (24.2 %), Finland (24.5 %), Denmark (25.1 %), Cyprus (25.2 %), Croatia (25.5 %), Latvia (25.7 %), Belgium (26.4 %), Romania (27.3 %), Hungary (28.1 %) and France (29.6 %). Countries that recorded a gender overall earnings gap higher than 40 % were Greece (41.2 %), Germany (41.9 %), Italy (43.0 %), the Netherlands (43.7 %) and Austria (44.2 %). Table 2 shows contributions to the gender overall earnings gap. At EU level, the gender pay gap, the gender employment gap and the gender hour’s gap contributed 36.7 %, 29.3 % and 34.0 %, respectively, to the gender overall earnings gap.
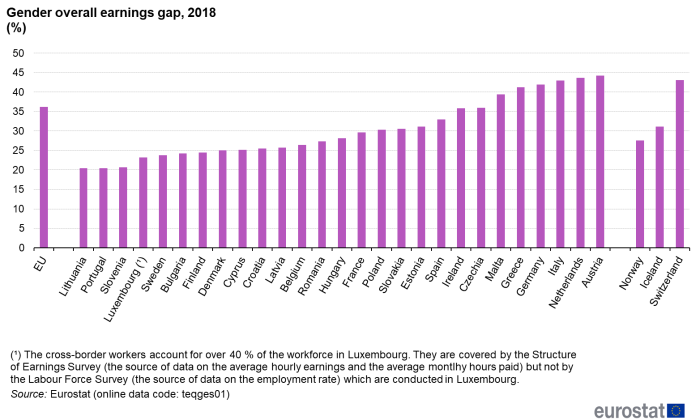
Source: Eurostat, (teqges01)
Life expectancy
Life expectancy at birth is one of the most frequently used indicators to measure the health status of a population. From the ‘life expectancy’ indicator, the gender gap in life expectancy at birth can be derived. This is defined as the number of years that men can expect to live (at birth) minus the number of years that women can expect to live.
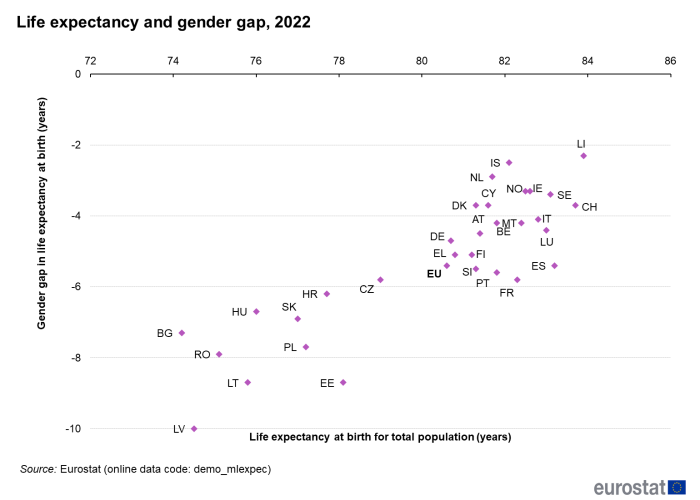
In 2022, the gender gap in life expectancy at birth was -5.4 years in the EU, meaning that life expectancy at birth was 5.4 years higher for women than for men. Life expectancy at birth was higher for women than for men in all EU Member States, with the negative gender gap ranging from -2.9 years in the Netherlands, -3.3 years in Ireland, -3.4 years in Sweden, -3.7 in both Cyprus and Denmark to -8.7 years in both Estonia and Lithuania to -10 years in Latvia (see Figure 6).
As regards the population as a whole, life expectancy at birth varied across EU Member States between 74.2 years in Bulgaria and 83.2 years in Spain. Among the countries with the largest gender gap in absolute terms (i.e. 8 years or more), life expectancy for the total population was 74.5 years in Latvia, 75.8 years in Lithuania, and 78.1 years in Estonia, much lower than the EU average of (80.6 years in 2022). Among the countries with the lowest gender gap in absolute terms (i.e. 4 years or below), life expectancy at birth for the total population was generally higher than the EU average — namely 81.3 years in Denmark, 81.6 years in Cyprus, 81.7 years in the Netherlands, 82.6 years in Ireland and 83.1 years in Sweden.
For a better view of gender issues concerning life expectancy, it is also useful to look at life expectancy by highest level of education attained, causes of death and hospital discharges by diagnosis, as well as healthy life years expectancy and lifestyle characteristics, e.g. smoking (see articles in Statistics Explained in the category Health).
Source data for tables and graphs
Data sources
Eurostat produces and disseminates a number of datasets that show how men and women compare in areas such as education, labour market, earnings, social inclusion and health in the EU. The most relevant and most frequently used datasets are listed in the ‘Equality’ domain. For more information on data sources and availability, see the metadata files linked to the multidimensional tables or in other relevant articles.
Gender overall earnings gap is calculated as follows:
where GOEG means Gender overall earnings gap, Em — Mean hourly earnings of men, Hm — Mean monthly hours paid to men, ERm — Employment rate of men (aged 15-64 years), Ew — Mean hourly earnings of women, Hw — Mean monthly hours paid to women and ERw — Employment rate of women (aged 15-64 years).
Context
Gender statistics are indispensable for identifying inequalities between women and men, and needed for the purposes of gender policy development and implementation at global, European and national levels. Four world conferences on women convened by the United Nations between 1975 and 1995 have been crucial in putting the cause of gender equality at the very centre of the global agenda. In 1995, the Fourth World Conference on Women held in Beijing adopted the Declaration and Platform for Action.
This specified critical areas of concern considered to represent the main obstacles to women’s advancement, requiring concrete action by governments and civil society. These areas are as follows: women and poverty, education and training of women, women and health, violence against women, women and armed conflict, women and the economy, women in power and decision-making, institutional mechanisms for the advancement of women, human rights of women, women and the media, women and the environment and the girl-child.
Following the 1995 conference in Beijing, the European Council requested an annual review of how EU Member States were implementing the Beijing Platform for Action. To track progress, each EU Council Presidency produces a report that covers developments in a specific critical area. Successive EU Council Presidencies have developed a set of indicators — called the Beijing indicators — covering most of the critical areas of the Beijing Platform for Action.
The principle of ‘equal pay for male and female workers for equal work or work of equal value’ has been enshrined in the European treaties since 1957. It is currently laid down in Article 157 of the Treaty on the Functioning of the European Union. It is also a fundamental right (Article 23 of the Charter of Fundamental Rights of the European Union).
The European Commission has confirmed that ‘reducing the gender pay, earnings and pension gaps and thus fighting poverty among women’ is among its top priorities. It has undertaken a number of initiatives in this field as part of the Gender equality strategy 2020–2025. The Commission communication that outlines this strategy calls for an increased participation of women in the labour market and equal participation across different sectors of the economy and working-time patterns. Moreover, it stresses the need for affordable care services of sufficient quality and calls for a better sharing of unpaid working hours between women and men. In addition, it calls for policies and measures for those facing particular barriers to entry into the labour market, such as migrant women and single parents. The document also argues that the causes and consequences of the gender pension gap need to be addressed, as they are an obstacle to the economic independence of women in old age, when they face a higher risk of poverty than men do.
The right of women and men to equal pay for work of equal value belongs to the European Pillar of Social Rights, which was endorsed at the Social Summit for Fair Jobs and Growth, Gothenburg, Sweden, November 2017. At the Porto Social Summit of May 2021, EU leaders reaffirmed their commitment to the implementation of the European Pillar of Social Rights according to the action plan set up by the Commission in March 2021. The unadjusted GPG (gender pay gap) belongs to the social scoreboard indicators used for the monitoring of the action plan.
The EU and its Member States are supported by the European Institute for Gender Equality in their efforts to promote gender equality and to raise awareness about gender equality issues. The Institute supports EU Presidencies in developing the Beijing indicators. It also developed the Gender Equality Index, which provides a synthetic measure of gender equality in EU Member States.

