Labour cost components
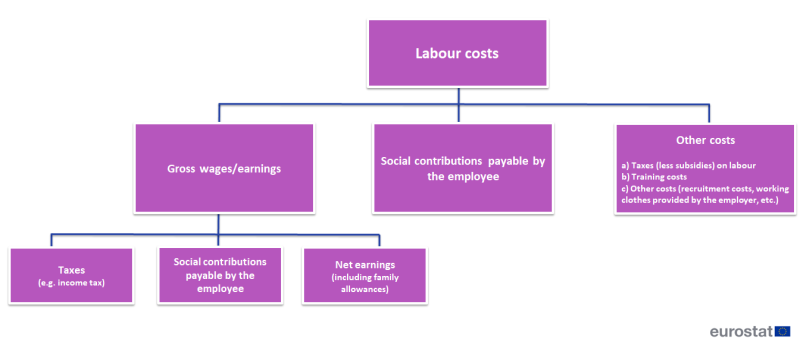
As far as employees are concerned, the compensation received for their work, more commonly called wages or earnings, generally represents their main source of income and therefore has a major impact on their ability to spend and/or save. Whereas gross wages/earnings include the social contributions payable by the employee, net earnings are calculated after deduction of these contributions and any amounts which are due to government, such as income taxes. As the amount of taxes generally depends on the situation of the household in terms of income and composition, net earnings are calculated for several typical household situations.
Diagram 1 summarises the relation between net earnings, gross earnings/wages and labour costs.
Labour costs
The average hourly labour cost in 2023 was estimated at €31.8 in the EU and at €35.6 in the euro area. However, this average masks significant differences between EU Member States, with hourly labour costs ranging between €9.3 in Bulgaria and €53.9 in Luxembourg (see Figure 1).
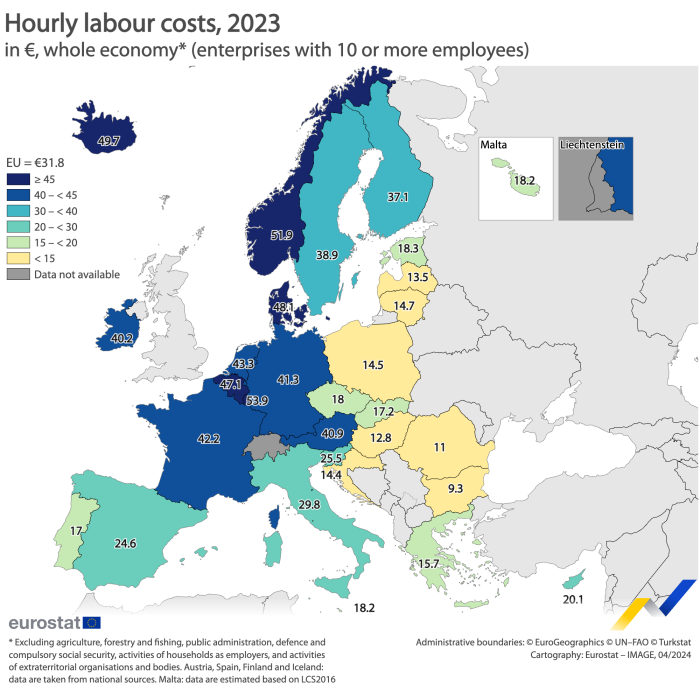
Source: Eurostat (lc_lci_lev)
Labour costs consist of costs for wages and salaries plus non-wage costs such as employers’ social contributions. In 2023, the share of non-wage costs in the total labour costs, for the whole economy, was 24.7 % in the EU against 25.5 % in the euro area. The share of non-wage costs also varied substantially across EU Member States: the highest shares of non-wage costs were recorded in Sweden (32.2 %) and France (31.9 %), while the lowest shares were recorded for Malta (1.4 %) Romania (5.0 %) and Lithuania (5.4 %).
Gross wages/earnings
Median earnings
Gross earnings are the largest part of labour costs. In 2018, the highest median gross hourly earnings in euro were recorded in Denmark (€27.2), Luxembourg (€19.6) and Sweden (€18.2), By contrast, the lowest median gross hourly earnings in euro were registered in Hungary (€4.4), Romania (€3.7) and Bulgaria (€2.4). In other words, across EU Member States, the highest national median gross hourly earnings were 11 times as high as the lowest when expressed in euros; when adjusted for price levels (by converting to purchasing power standards (PPS)) the highest average was four times as high as the lowest average, with Denmark and Bulgaria again representing the extremes at either end of the range.
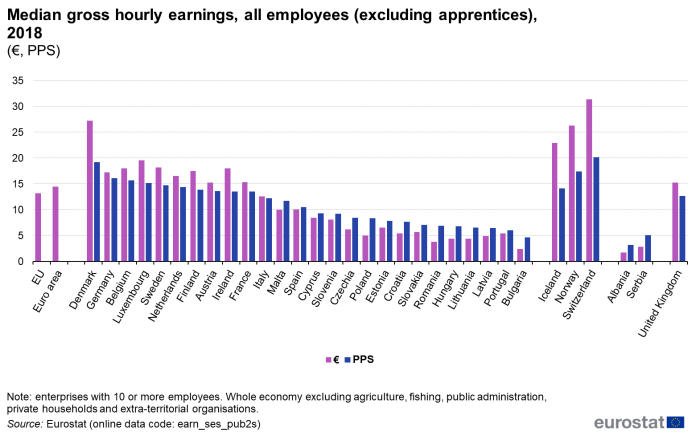
(excluding apprentices), 2018
Source: Eurostat (earn_ses_pub2s)
Low-wage earners
Low-wage earners are defined as employees who earn two-thirds or less of national median gross hourly earnings. In 2018, 15.3 % of the employees were low-wage earners in the EU compared with 16.4 % in 2014. In 2018, the proportion of low-wage earners was 15.1 % in the euro area compared with 15.9 % in 2014. This proportion varied significantly between EU countries: in 2018, the highest shares were observed in Latvia (23.5 %), Lithuania (22.3 %) and Estonia (22.0 %). By contrast, less than 10 % of employees were low wage earners in Denmark (8.7 %), France (8.6 %), Italy (8.5 %), Finland (5.0 %), Portugal (4.0 %) and Sweden (3.6 %).
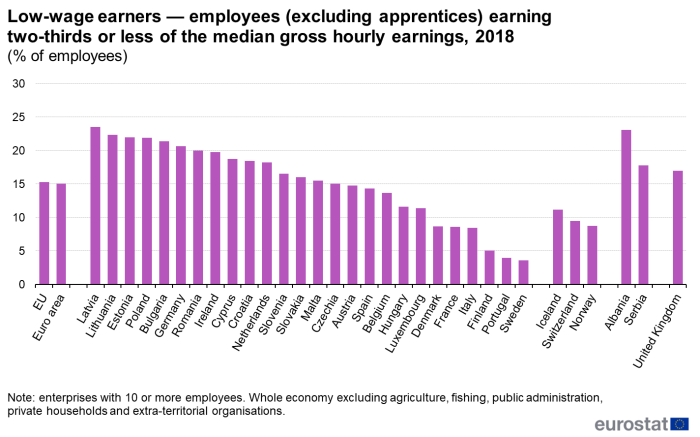
(excluding apprentices) earning two-thirds or less of the median gross hourly earnings, 2018
(% of employees)
Source: Eurostat (earn_ses_pub1s)
Gender pay gap
The unadjusted gender pay gap is an important indicator to measure differences between the average earnings of men and women in the EU. In 2022, in the EU as a whole, women were paid, on average, 12.7 % less than men, while the difference was 13.2 % for the euro area. The largest gender pay gaps were identified in Estonia (21.3 %), Austria (18.4 %) and Czechia (17.9 %). The least differences were found in Luxembourg (-0.7 %) – the negative sign meaning that women were paid, on average, slightly more than men – followed by Italy (4.3 %), Romania (4.5 %) and Belgium (5.0 %), see Figure 4.
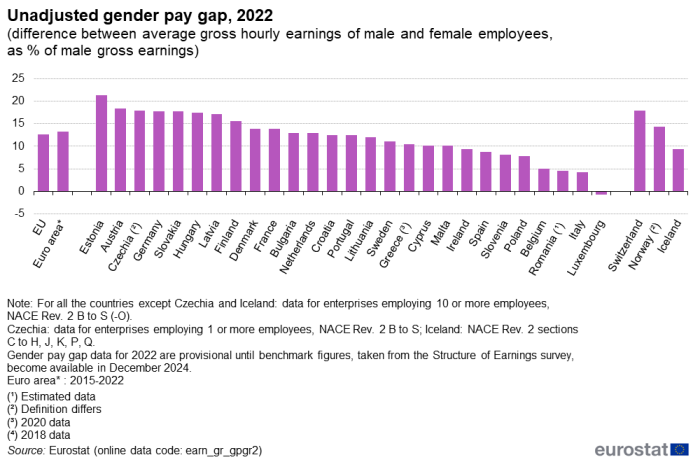
(difference between average gross hourly earnings of male and female employees, as % of male gross earnings)
Source: Eurostat (earn_gr_gpgr2)
Various issues contribute to these gender pay gaps, such as: differences in labour force participation rates, differences in the occupations and activities that tend to be male- or female-dominated, differences in the extent to which men and women work on a part-time basis, as well as the attitudes of personnel departments within private and public bodies towards career development and unpaid and/or maternity/parental leave. Some underlying factors that may, at least in part, explain gender pay gaps include sectoral and occupational segregation, education and training, awareness and transparency, as well as direct discrimination. Gender pay gaps also reflect other inequalities, in particular, women’s often disproportionate share of family responsibilities and associated difficulties of reconciling work with private life. Many women work part-time or under atypical contracts: although this permits them to remain in the labour market while managing family responsibilities, it can have a negative impact on their pay, career development, promotion prospects and pensions.
Net earnings and tax burden
All the data are based on a widely acknowledged model developed by the OECD, where figures are obtained from national sources (for further details on the model consult the information on the OECD – Benefits and wages website).
Net earnings
Information on net earnings complements gross earnings data with respect to disposable earnings, in other words after the deduction of income taxes and employee social security contributions from the gross amounts and the addition of family allowances (cash transfers paid in respect of dependent children), in the case of households with children.
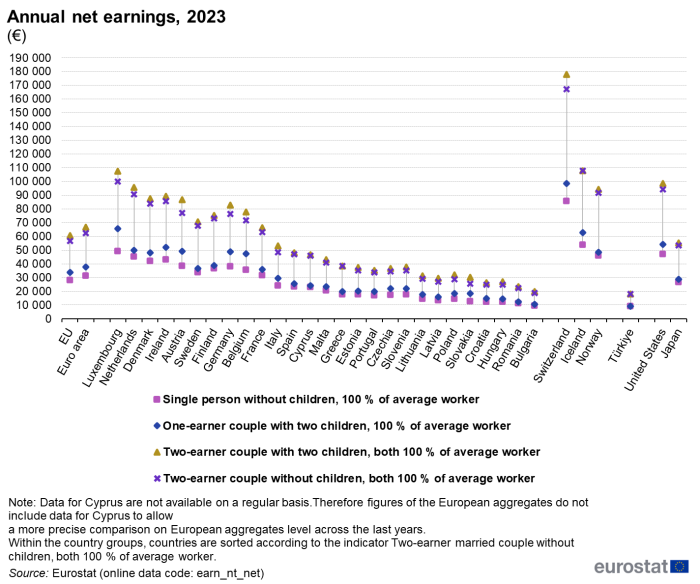
In 2023, the net earnings of a single person earning 100 % of the average earnings of a worker in the business economy, without children, ranged from €9 355 in Bulgaria to €49 035 in Luxembourg. The same two EU countries recorded the lowest (€10 644) and the highest (€65 728) average net earnings, respectively, for a married couple with a single earner and two children (see Figure 5).
In the case when both partners of a married couple work (both earning an average worker’s earnings), Luxembourg recorded the highest annual net earnings, both when the couple had two children (€107 590 ) and when the couple had no children (€99 926). Bulgaria recorded the lowest net earnings for couples with two children (€19 938) or none (€18 710).
Tax burden
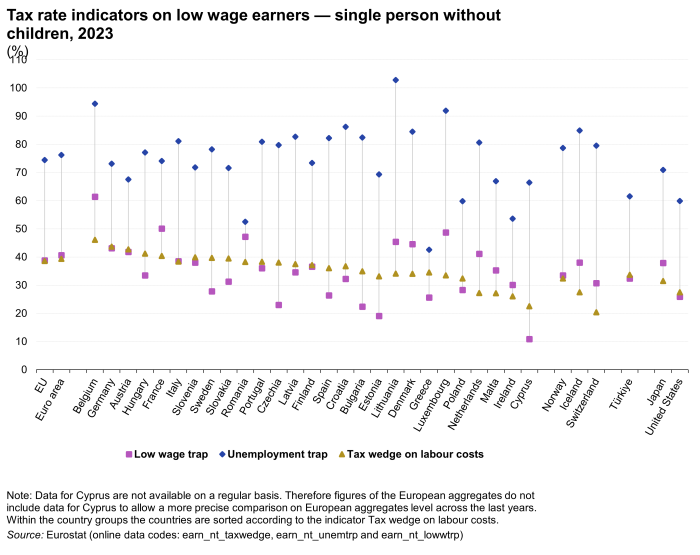
Tax rate indicators (tax wedge on labour costs, unemployment trap and low wage trap) aim to monitor work attractiveness. Figure 6 presents them for a low wage earner who earns two-thirds (67 %, to be exact) of the average earnings of a worker in the business economy (NACE Rev. 2, Sections B to N) and who is a single person without children.
The first indicator, tax wedge on labour costs, measures the burden of tax and social security contributions relative to labour cost. It is defined as income tax on gross wage earnings plus employee and employer social security contributions, expressed as a percentage of total labour costs. This tax wedge for the EU was 38.6 % (39.3 % for the euro area) in 2023. The highest tax wedges on labour costs of low-wage earners in 2023 were recorded in Belgium (46.1 %), Germany (43.7 %), Austria (42.7 %) and Hungary (41.2 %) and the lowest ones in Cyprus (22.5 %) followed by Ireland (26.0 %), Malta (27.1 %) and the Netherlands (27.2 %).
The second indicator, unemployment trap, measures the proportion (as a percentage) in the increase of gross earnings that is ‘taxed away’ by higher tax and employee social security contributions and the withdrawal of unemployment and other benefits when an unemployed person moves into employment (assuming he/she is a single person without children earning 67 % of the average wage when in work). In 2023, the unemployment trap stood at 74.4 % in the EU (76.2 % for the euro area). The highest rates were recorded in Lithuania (102.8 %), Belgium (94.4 %) and Luxembourg (91.9 %) and the lowest ones in Greece (42.6 %) followed by Romania (52.5 %) and Ireland (53.6 %).
The third indicator, low wage trap, measures the proportion (as a percentage) in the increase of gross earnings that is ‘taxed away’ through the combined effects of income taxes, employee social security contributions, and any withdrawal of benefits when gross earnings increase from 33 % to 67 % of the average earnings of a worker. The low wage trap was recorded at 38.8 % in the EU in 2023 (40.6 % for the euro area), with the highest rates observed in Belgium (61.4 %), France (50.1 %), Luxembourg (48.7 %), Romania (47.2 %), Lithuania (45.4 %), Denmark (44.6 %) and Germany (43.1 %) and the lowest ones in Cyprus (10.9 %), Estonia (19.1 %), Bulgaria (22.4 %), Czechia (23.0 %) and Greece (25.6 %).
Source data for tables and graphs
Data sources
Labour costs
Labour costs encompass employee compensation (including wages, salaries in cash and in kind, employers’ social security contributions), vocational training costs, and other expenditure (such as recruitment costs, expenditure on work clothes, and employment taxes regarded as labour costs minus any subsidies received). These labour cost components and their elements are defined in Regulation 1737/2005 of 21 October 2005.
Labour cost statistics constitute a hierarchical system of multi-annual, annual and quarterly statistics, designed to provide a comprehensive and detailed picture of the level as well as the structure and short-term development of labour costs in the different sectors of economic activity in the EU Member States and some non-member countries. All statistics are based on a harmonised definition of labour costs.
The labour cost levels are based on the latest labour cost survey (currently 2020) and an extrapolation based on the annual labour cost index (calculated based on the quarterly data). The data is available for all NACE Rev. 2 sections except ‘A – Agriculture, forestry and fishing’, ‘O – Public administration and defence; compulsory social security’, ‘T – Activities of households as employers; undifferentiated goods – and services – producing activities of households for own use’ and ‘U – Activities of extraterritorial organisations and bodies’.
The labour cost survey is a four-yearly survey that collects levels of labour costs at very detailed breakdowns. For the extrapolation with the labour cost index, data are only used at an aggregated level. The data is available for all NACE Rev. 2 sections except ‘A – Agriculture, forestry and fishing’, ‘O – Public administration and defence; compulsory social security’, ‘T – Activities of households as employers; undifferentiated goods – and services – producing activities of households for own use’ and ‘U – Activities of extraterritorial organisations and bodies’. The data for NACE Rev. 2 ‘O – Public administration and defence; compulsory social security’ is collected voluntarily.
The quarterly labour cost index (a Euroindicator) measures the cost pressure arising from the labour production factor. The data covered in the labour cost index collection relate to total average hourly labour costs and the two main labour cost components: wages and salaries and non-wage component (composed of employers’ social security contributions plus taxes paid minus subsidies received by the employer). The data is available for European aggregates (EU and euro area), EU Member States as well as EFTA countries (Iceland and Norway). Covered are all NACE Rev. 2 sections except ‘A – Agriculture, forestry and fishing’, ‘T – Activities of households as employers; undifferentiated goods – and services – producing activities of households for own use’ and ‘U – Activities of extraterritorial organisations and bodies’.
The data is available as non-adjusted, working day as well as seasonally adjusted.
Gross wages/earnings
The main definitions for earnings are provided in Regulation 1738/2005 of 21 October 2005. Data come from the four-yearly structure of earnings survey (SES) whose latest vintage dates from October 2018. Gross earnings cover monetary remuneration paid directly by the employer, before tax deductions and social security contributions payable by wage earners and retained by the employer. All bonuses, regardless of whether or not they are regularly paid (such as 13th or 14th month pay, holiday bonuses, profit-sharing, allowances for leave not taken, occasional commissions, and so on) are included.
Data on median earnings are based on gross hourly earnings of all employees (full-time and part-time, but excluding apprentices) working in enterprises with 10 or more employees and in all sectors of the economy except agriculture, fishing, public administration, private households and extra-territorial organisations. Median earnings are calculated such that half of the population earns less than the median and the other half earns more.
Gender pay gap
The gender pay gap, in its unadjusted form, is defined as the difference between average gross hourly earnings of male paid employees and female paid employees, expressed as a percentage of average gross hourly earnings of male paid employees. The methodology for the compilation of this indicator is benchmarked on data collected from the structure of earnings survey (SES), which is revised every four years when fresh data from the structure of earnings survey become available.
According to the methodology used, the indicator concerning the unadjusted gender pay gap covers all employees (there are no restrictions for age and hours worked) of enterprises (with at least 10 employees) within industry, construction and services (as covered by NACE Rev. 2 Sections B to S excluding O). Some countries also provide information for NACE Rev. 2 Section O (public administration and defense; compulsory social security) although this is not obligatory. Information is also available with an analysis between the public and private sectors, by working time (full-time or part-time) and based on the age of employees.
Net earnings and tax burden
Net earnings are derived from gross earnings and represent the part of remuneration that employees can actually keep to spend or save. Compared with gross earnings, net earnings do not include social security contributions and taxes, but do include family allowances.
The unemployment trap is defined as the difference between the increase of gross earnings and the increase of net income when moving from unemployment to employment, expressed as a percentage of gross earnings.
Context
The structure and development of labour costs and earnings are important features of any labour market, reflecting labour supply from individuals and labour demand by enterprises.
The EU seeks to promote equal opportunities implying progressive elimination of the gender pay gap. Article 157(1) of the Treaty on the functioning of the European Union (TFEU) sets out the principle of equal pay for male and female workers for equal work or work of equal value, and Article 157(3) provides the legal basis for legislation on the equal treatment of men and women in employment matters.
The European Commission has confirmed that ‘reducing the gender pay, earnings and pension gaps and thus fighting poverty among women’ is among its top priorities. It has undertaken a number of initiatives in this field as part of the Gender Equality Strategy 2020-2025.
The Commission communication that outlines this strategy calls for an increased participation of women in the labour market and equal participation across different sectors of the economy and working-time patterns. Moreover, it stresses the need for affordable care services of sufficient quality and calls for a better sharing of unpaid working hours between women and men.
In addition, it calls for policies and measures for those facing particular barriers to entry into the labour market, such as migrant women and single parents.

