What is the sports sector?
For the purposes of this article, the sector includes:
- sporting activities
- sports education
- manufacturing of sports goods.
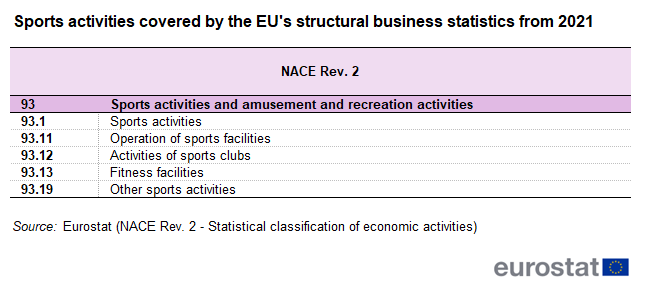
From reference year 2021, with the implementation of the new business statistics regulation 2019/2152, the SBS cover the core sporting activities, defined by the Vilnius Definition of sport under NACE Rev.2 group 93.1 — Sports activities. Table 1 shows the details of this NACE group and its classes at 4 digits level.
To provide a complete picture, in addition to NACE group 93.1, this article focuses also on two other NACE codes covering different aspects related to the broad definition of sport:
- NACE class 85.51 — Sports and recreation education
- NACE group 32.3 — Manufacturing of sports goods.
Sports activities enterprises in the EU: main indicators
Enterprises in the sports sector in 2021 generated €25 billion in value added
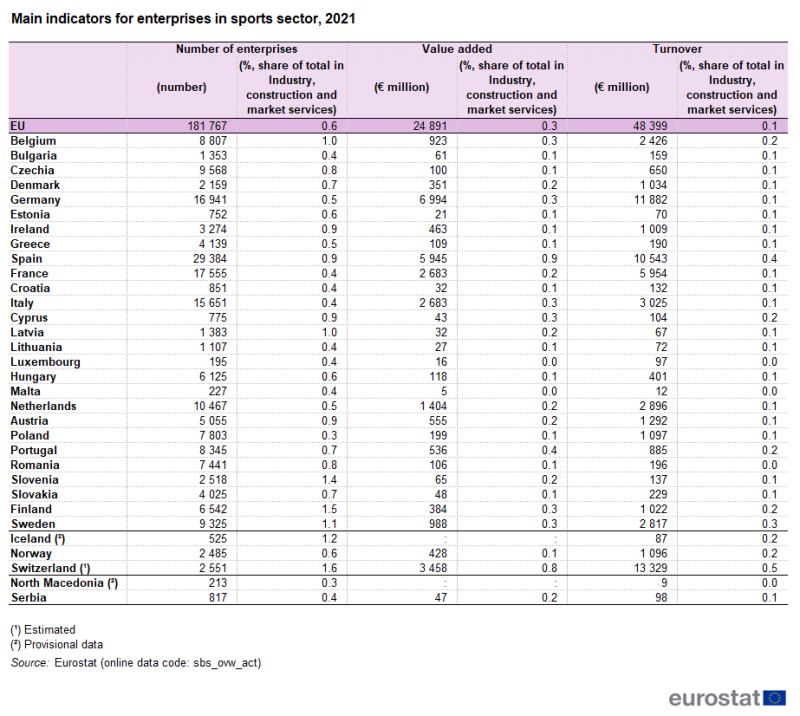
In 2021, in the EU overall, there were around 182 000 enterprises active in the sports sector, representing 0.6 % of all business in the industry, construction and market services. These enterprises generated € 25 billion in value added, while their turnover (the total value of market sales of goods and services) totalled around € 48 billion. These values equated, respectively, to 0.3 % of value added and 0.1 % of turnover for all businesses in industry, construction and market services (see Table 2).
At national level, the share of enterprises in the sports sector out of all business in industry, construction and market services was higher than 1 % in Finland (1.5 %), Slovenia (1.4 %) and Sweden (1.1 %), while it had its lowest value in Poland (0.3 %). Spain registered the highest value added and turnover, respectively accounting for 0.9 % and 0.4 % of the total national economy.
Source: Eurostat (sbs_ovw_act)
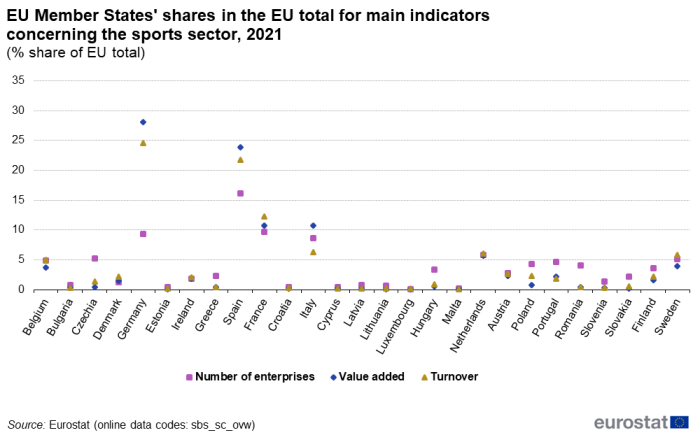
In 2021, Spain, France, Germany, and Italy accounted altogether for more than 40 % of the total number of enterprises in the sports sector in the EU, with the largest share in Spain (16.2 %) (see Figure 1).
In that year, the highest share of value added by enterprises in the sports sector in the EU was recorded from the same four countries, particularly by Germany (28.1 % of the EU total) and Spain (23.9 %). Together these countries accounted for more than half of the total value added by the EU sporting sector in 2021. Germany and Spain also had the most significant shares in terms of turnover, collectively accounting for 46.3 % of the turnover generated by EU enterprises in the sports sector.
(%, share of EU total)
Source: Eurostat (sbs_ovw_act)
In 2021 fitness facilities accounted for more than half of businesses in the sports sector in Cyprus and Greece
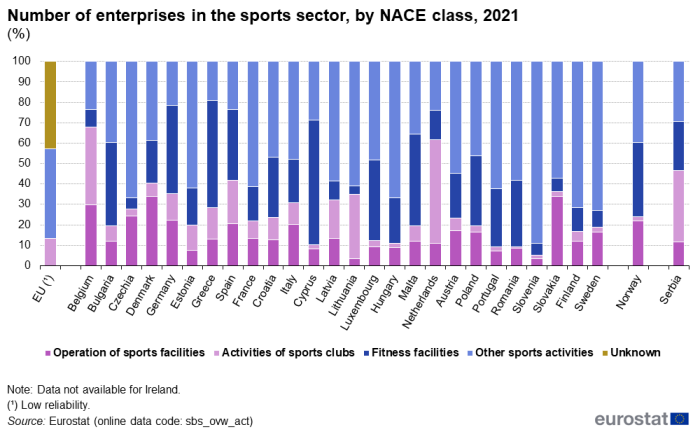
Going into the detailed activity of the sport businesses in 2021, the NACE class 93.14 ‘other sports activities’ led with the largest share in the number of enterprises in the sports sector in 18 EU Member States (headed by Slovenia, where it amounted to 89.2 % of all enterprises in the sports sector).
‘Other sports activities’ includes activities by producers and promoters of sports events, individual own-account sportsmen and athletes, referees, judges, timekeepers and activities by sports leagues and regulating bodies.
‘Fitness facilities’ was the largest group of business activities in the sports sector in six EU Member States, with more than half of enterprises in the sports sector in Cyprus (61 %) and Greece (52.7 %). In addition, enterprises in the sports sector involved in activities under the heading ‘activities of sport clubs’ were most numerous in the Netherlands (50.7 %) and Belgium (38.4 %) (see Figure 2).
(%)
Source: Eurostat (sbs_ovw_act)
In 2021 in the EU activities of sport clubs accounted for almost half of the total value added by the enterprises in the sports sector
In 2021, ’activities of sport clubs’ accounted for almost half (45.4 %) of the total value added under the enterprises in the sports sector.
At national level, the picture is more varied, as shown by Figure 3. In 2021, activities by sport clubs accounted for most of the value added by all enterprises in the sports sector in 12 EU Member States, with the highest shares in Italy (62.4 %), Portugal (58.8 %) and Spain (57.3 %). In turn, in the same year, seven EU member States recorded negative figures for value added by activities of sport clubs, meaning that they were not able to produce any gross income in that period.
Six EU Member States (headed by Slovakia with 96.4 %) recorded the highest share of the value added by enterprises in the sports sector for ‘operation of sports facilities’. Romania (62.2 %) and Malta (48.6 %) recorded such shares in ‘fitness facilities’, while the remaining six EU Member States (no data available for Ireland) recorded such shares in ‘other sports activities’.
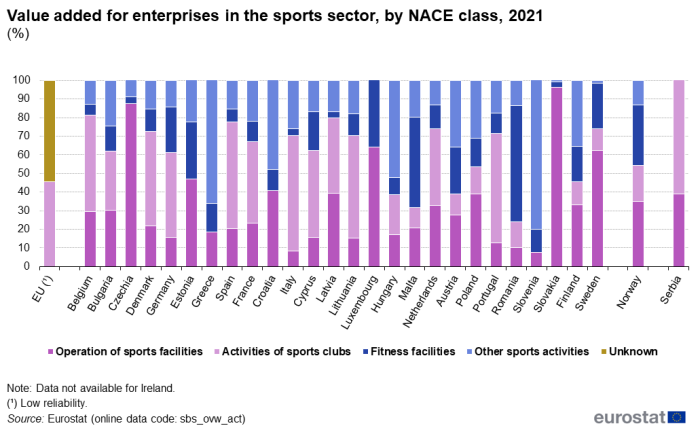
(%)
Source: Eurostat (sbs_ovw_act)
How big are the enterprises in the sports sector?
Small and medium-sized enterprises (‘SMEs’) are vital to the EU’s economy. Driving job creation and economic growth, they play a prominent role in EU policy development. As in other industries, SMEs (defined as businesses with less than 250 employees) account for the majority of EU enterprises in the sports sector.
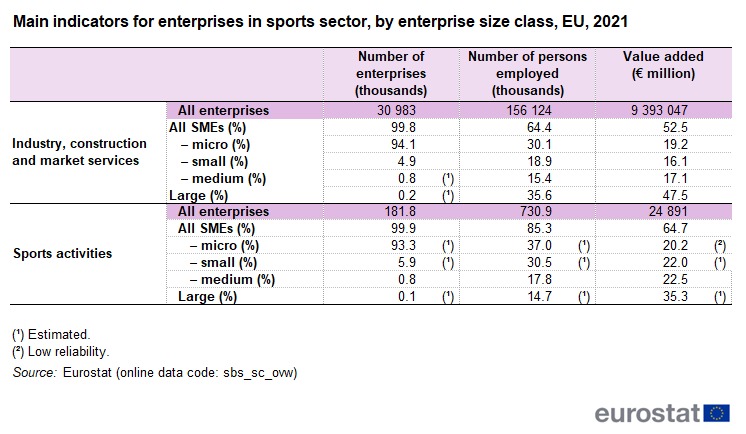
Table 3 shows the set of main indicators for enterprises in the sports sector, by business size class (defined by the number of people employed).
In 2021, SMEs made up the largest proportion of EU enterprises in the sports sector (99.9 %), a percentage aligned with their share of enterprises in industry, construction and market services (99.8 %). Closer analysis reveals that most SMEs in this sector (93.3 %) were micro businesses (with fewer than 10 employees).
Despite accounting for a dominant share of the enterprises in the sports sector, micro enterprises employed only 37 % of the workforce (compared with 30.1 % on average for all businesses in industry, construction and market services). Large enterprises (employing 250 people or more) operating in the sports sector accounted for more than a quarter of the workforce (14.7 %), lower than their proportion of all enterprises in industry, construction and market services (35.6 %).
Further analysis shows that, in 2021, SMEs generated almost two-thirds (64.7 %) of the value added by the EU’s enterprises in the sports sector. This proportion was significantly higher than that of all enterprises in industry, construction and market services (52.5 %). As such, this highlights the importance of SMEs in this sector.
Source: Eurostat (sbs_sc_ovw)
Sports education enterprises in the EU
Sports education includes the provision of instruction in athletic activities to groups of individuals, such as by camps and schools (e.g. team sports, swimming, yoga instructions etc.).
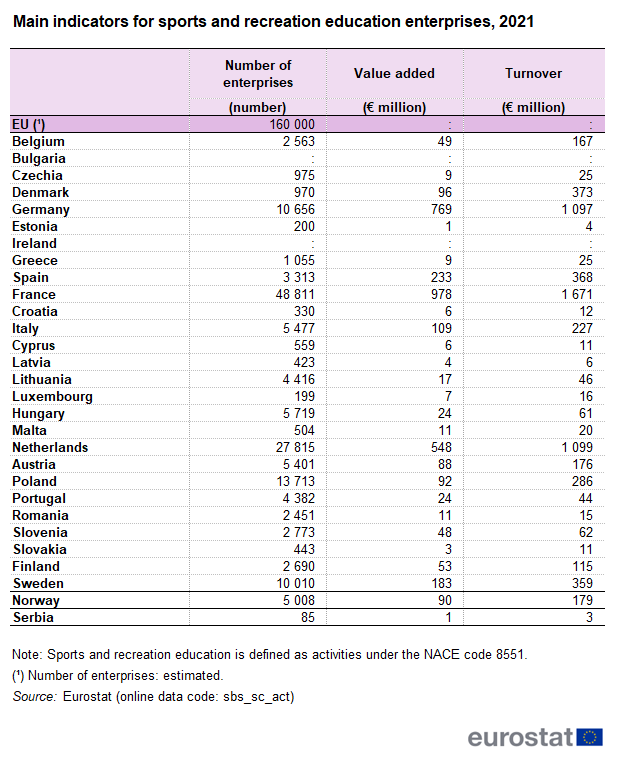
Sport plays also an important role in terms of educational businesses: in 2021 in the EU the number of enterprises for sports and recreation education was estimated around 160 000.
Almost 50 000 enterprises for sports and recreation education were registered in France, followed by the Netherlands with around 28 000 businesses: together these two countries accounted for almost half of the number of enterprises for sports and recreation education in the EU (see Table 4).
In 2021, France registered the highest value added by enterprises for sports and recreation education in the EU, with almost € 1 billion, followed by Germany (€ 769 million from only around 10 000 enterprises), and the Netherlands (€ 548 million from 28 000 enterprises). The same three EU Member States were the only ones to record over € 1 billion in turnover from enterprises for sports and recreation education in 2021. While France was still comfortably above the other countries with almost € 1.7 billion, Germany and the Netherlands had basically the same value (€ 1.1 billion).
Source: Eurostat (sbs_sc_act)
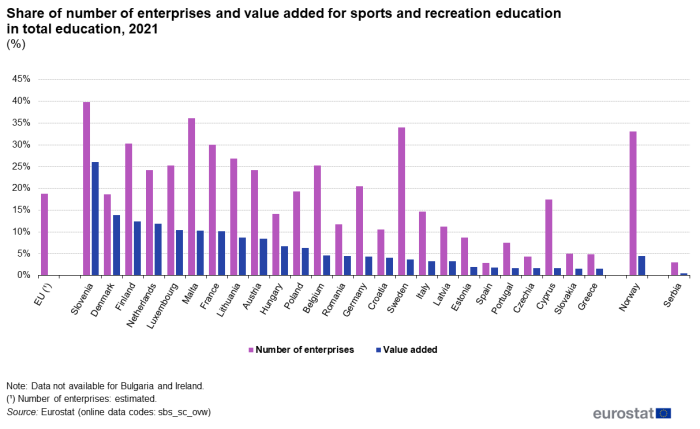
In 2021, in the EU the number of enterprises for sports and recreation education accounted for almost one-fifth of all enterprises in the field of education (this is calculated as the number of enterprises in NACE class 85.51 over NACE division 85 – but only private business, and not public education institutions, are taken into account).
Three EU countries had over one-third of enterprises for sports and recreation education in total education: Slovenia (39,8 %), Malta (36.1 %) and Sweden (34.0 %). On the other hand, this share was under 5 % in Greece (4.8 %), Czechia (4.3 %) and Spain (2.9 %).
Slovenia confirmed its leading status in the EU for sports and recreation enterprises in total education also in terms of value added, with a 26.1 % of value added by sports and recreation enterprises in total education belonging to sports and recreation enterprises. This share is almost double that of the next country, Denmark, with 13.9 %, despite having only 18.7 % of sports and recreation education companies in total education. By contrast, six Member States recorded a share of value added for sports and recreation education in total education lower than 2 %, with lowest figures in Slovakia (1.6 %) and Greece (1.5 %).
(%)
Source: Eurostat (sbs_sc_act)
Who produces sporting goods in the EU?
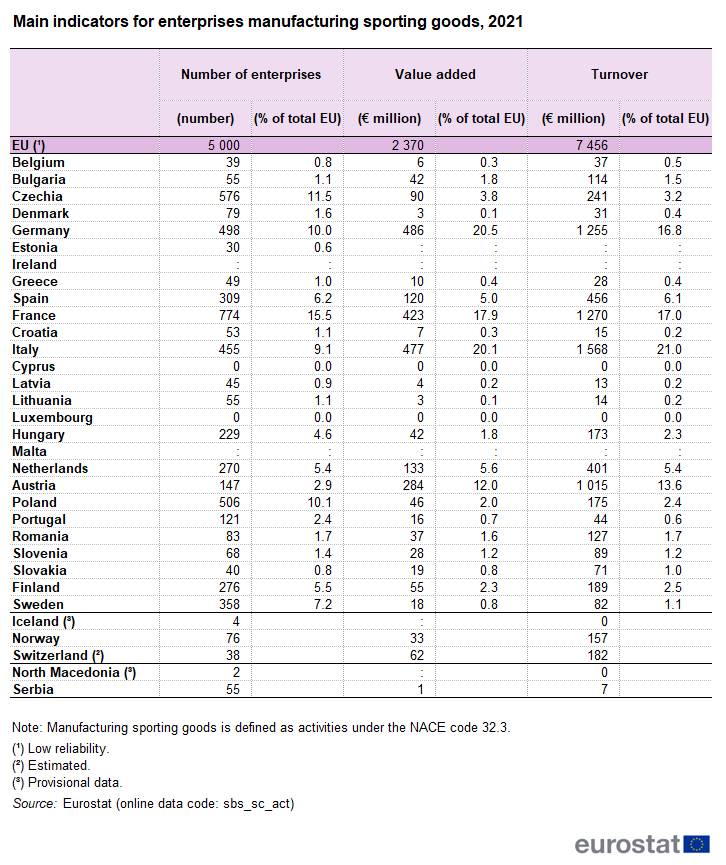
Another important dimension of the sector is manufacturing of sporting goods, measured by the dedicated NACE group 32.3. In 2021 in the EU an estimated 5 000 enterprises manufacturing sporting goods generated € 2.4 billion in value added, with turnover totalling around € 7.5 billion (see Table 5).
France, Czechia, Poland and Germany accounted for almost half of the total number of enterprises that manufacture sporting goods in the EU (no data available for Ireland and Malta), each of them with a share of at least 10 % of the EU total of such enterprises. For four countries (Latvia, Belgium, Slovakia and Estonia) the percentage was less than 1 %, while two countries (Cyprus and Luxembourg) did not report any data on enterprises in this sector.
In 2021, Germany (€ 486 million generated) and Italy (€ 477 million) ranked at the top with over 20 % of the total EU value added of enterprises manufacturing sporting goods. Together with France and Austria, these countries accounted for over 70 % of the total EU value added.
Comparing the value added with the number of enterprises, the same countries do not necessarily show the most notable values in both indicators. For instance, Austria manufactured one of the highest shares of total EU value added (12 %), but with a relatively low share of enterprises (2.9 %). By contrast, Poland had the third highest share of enterprises in the EU (10.1 %) but produced only a relatively low share of the value added (2 %).
As for turnover generated by sports goods manufacturers, over 20 % of the EU total was recorded in Italy (21 %). The other main shares belonged to the same EU Member States as for value added – France (17 %), Germany (16.8 %) and Austria (13.6 %).
Source: Eurostat (sbs_sc_act)
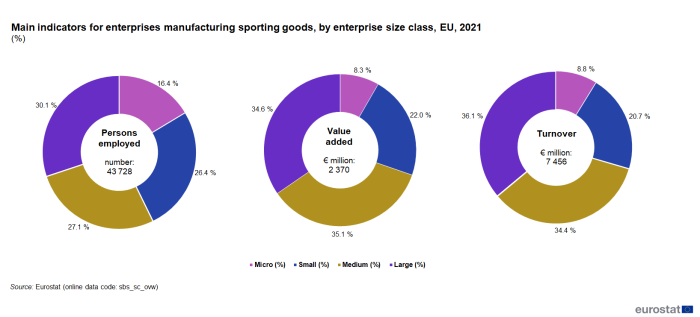
As for sports activities, small and medium-sized enterprises (SMEs) also play a key role in manufacturing sporting goods. In 2021, SMEs accounted for around 70 % of people employed in sports manufacturers, with 16.4 % employed in micro enterprises (fewer than 10 employees).
In addition, Figure 5 shows that in 2021 SMEs generated around two-thirds (65.4 %) of the value added and 63.9 % of turnover of EU sports manufacturers.
Source: Eurostat (sbs_sc_ovw)
Source data for tables and graphs
Data sources
The identification of the list of sporting goods is based on:
Eurostat compiles data on sport-related enterprises from the Structural business statistics (SBS).
Structural business statistics
Structural business statistics (SBS) cover industry, construction, trade and (market) services, as defined by the statistical classification of economic activities in the European Community (NACE).
This classification allows for a detailed sectoral breakdown of business activities. The information is available for a broad range of structural indicators (including data for the number of businesses, the number of people employed, turnover and value added) and can also be broken down by business size. The version of NACE currently used in the European statistical system is NACE Rev. 2, implemented from 2008 onwards.
SBS describe the structure, conduct and performance of businesses within the non-financial business economy (NACE sections B to S, except public administration and defence, compulsory social security, and activities of membership organisations).
Starting with the reference year 2021, Structural Business Statistics are compiled under EU regulation 2019/2152 and its implementing act, EU regulation 2020/1197.
Within the context of SBS, the following definitions apply:
- An enterprise as defined in Council Regulation (EEC) No 696/93 is the smallest combination of legal units that is an organizational unit producing goods or services, which benefits from a certain degree of autonomy in decision-making, especially for the allocation of its current resources. An enterprise carries out one or more activities at one or more locations. An enterprise may be a sole legal unit.
- Number of active enterprises is the number of all statistical units which at any time during the reference period were ‘enterprises’, as defined in Council Regulation (EEC) No 696/93, and active during the same reference period. A statistical unit is considered to have been active during the reference period, if in said period it either realized positive net turnover or produced outputs or had employees or performed investments.
- Number of employees and self-employed persons (the number of persons employed) is the sum of the Number of employees and Number of self-employed persons. The ‘number of employees’ represents the average number of persons who were, at some time during the reference period, employees of the statistical unit. The ‘number of self-employed persons’ is the average number of persons who were at some time during the reference period the sole owners or joint owners of the statistical unit in which they work. Family workers and outworkers whose income is a function of the value of the outputs of the statistical unit are also included.
- Net turnover comprises all income generated during the reference period through the regular activities of the statistical unit and is presented after deducting all price reductions, discounts, and rebates granted by it. Excluded from net turnover are:
- all taxes, duties or levies linked directly to revenue;
- any amounts collected on behalf of any principal, if the statistical unit is acting as an agent in its relationship with said principal;
- all income not arising in the course of ordinary activities of the statistical unit. Usually, these types of income are classified as ‘Other (operating) income’, ‘Financial income’, ‘Extra-ordinary income’ or under a similar heading, depending on the respective set of generally accepted accounting standards used to prepare the financial statements.
- Value added is a composite indicator of net operating income, adjusted for depreciation, amortization and employee benefits, all components being recognized as such by the statistical unit during the reference period. Its value is given by the formula:
- net turnover (+)
- income from product- or turnover-related subsidies (+)
- capitalized output (+)
- change in stock of goods (±)
- total purchases of goods and services (-).
Alternatively, it can be calculated from the gross operating surplus by adding personnel costs.
SBS may be broken down by business size-class for analytical purposes, as follows:
- Small and medium-sized enterprises (SMEs) employing 1 to 249 people, composed of:
- micro enterprises with less than 10 people employed;
- small enterprises with 10 to 49 people employed;
- medium-sized enterprises with 50 to 249 people employed.
They should also have an annual turnover of up to €50 million, or a balance sheet total of no more than € 43 million.
- Large enterprises with 250 or more people employed.
Whenever the EU aggregates do not rely on a full coverage, estimates can be published. In these cases such data are flagged as Estimated value (precise within ±1% or Unreliable or uncertain data: (Estimation error from ±1 % to ±5 %). For more details see Structural business statistics (sbs).
Context
The multiannual work programme (EU Work Plan for Sport 2021–2024) agreed by the EU Council, sets the priorities and principles for cooperation between the European Commission and Member States in the field of sport.
Several expert groups have been set up to achieve concrete results. Among them, the Expert Group on the Economic Dimension of Sport (XG ECO) and the Expert Group on Health-Enhancing Physical Activity (XG HEPA) play a key role in implementing evidence-based policies in the sports sector.
XG ECO, for example, has developed an economic definition of sport (Vilnius definition), and made progress towards developing Sport Satellite Accounts in some EU countries. XG HEPA is working on implementing the Council recommendations on physical activity adopted in 2013. These include a monitoring framework with indicators for both the level of physical activity and policies to promote physical activity in EU countries.
Eurostat comparable data on international trade, employment in sport, participation in sporting activities, etc. make a valuable contribution to monitoring and developing the EU’s policies in this area.

