Europeans stay more than one week on average when visiting other EU countries
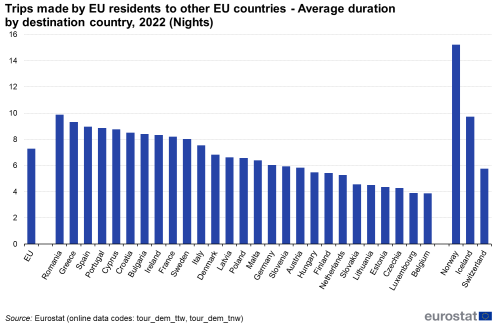
In 2022, tourism trips made by EU residents to another EU Member State had an average duration longer than one week (7.3 nights), ranging from 3.9 nights for trips to Belgium and Luxembourg to 9.9 nights for trips to Romania (see Figure 1).
Differences in the duration of trips across Europe are often associated with accessibility in terms of transport and the proximity of the main generating markets. For instance, the relative price (and distance) to reach Romania will motivate tourists to stay longer, while the proximity and accessibility of Belgium to its main generating market (the Netherlands, followed by France) will make short breaks of a few days the more likely way of visiting this country. This also applied to Luxembourg, whose main generating market was the nearby Germany, followed by the Netherlands.
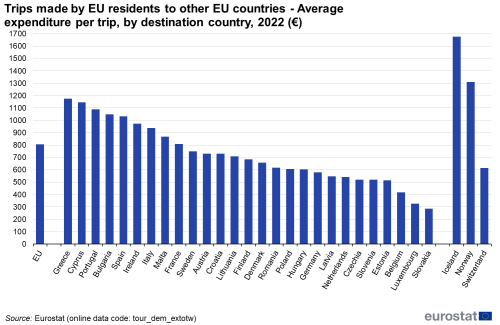
Average expenditure on trips to another EU country is €805
Inbound visitors coming from other EU Member States spent on average €805 (see Figure 2), ranging from €285 in Slovakia (a country seeing many tourists from neighbouring countries on a short trip – see also Figure 1) to €1 175 in Greece, followed by Cyprus (€1 145), Portugal (€1 089), Bulgaria (€1 049) and Spain (€1 033). These five destinations have relatively long stays of at least 8 nights on average and a prevalence (69 % of trips or more) of air travel to reach the country (see Table 1).
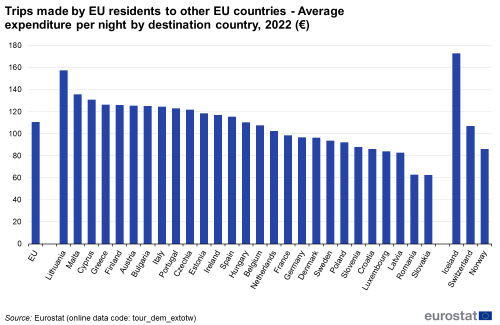
Per night, visitors from the EU to other EU countries spent on average €111 (see Figure 3), ranging from €63 for trips to Romania and Slovakia to €157 per night for trips to Lithuania.
For intra-EU trips, car is the dominant means of transport
Residents of the EU made 202 million tourism trips of at least one overnight stay to destinations in another EU Member State in 2022. For 47 % of those trips, rented or private motor vehicles were the main means of transport (see Table 1), followed by airplane (39 %). Train (6 %), bus (5 %) and transport using waterways (3 %) were far less significant.
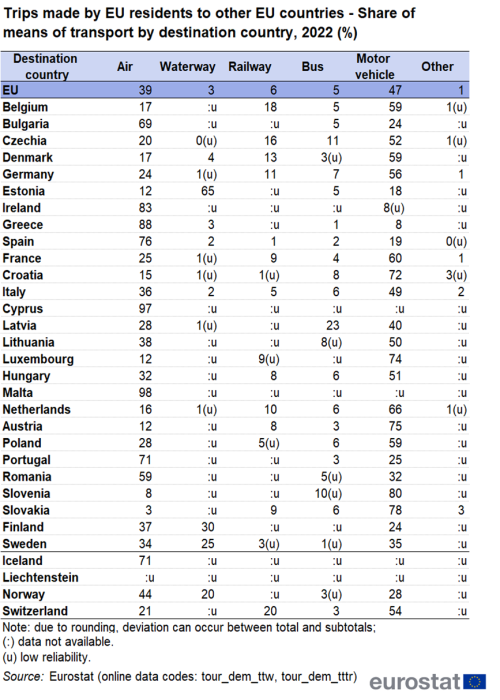
When looking at the countries visited, air transport accounted for at least three out of four intra-EU inbound flows in Malta (98 %), Cyprus (97 %), Greece (88 %), Ireland (83 %) and Spain (76 %). Note that all these destinations are islands, or have an important part of their destinations situated on islands (Greek Islands, Canary or Balearic Islands etc).
In five countries, the share of inbound trips made by motor vehicle was 70 % or more: Slovenia (80 %), Slovakia (78 %), Austria (75 %), Luxembourg (74 %) and Croatia (72 %).
Only in Estonia was waterway the dominant means of transport for inbound visitors (65 % of all intra-EU trips) most likely because of the popular ferry connection between Tallinn and Helsinki. The share of waterway was particularly high also for intra-EU trips to Finland (30 %) and Sweden (25 %).
Railway was relatively significant for visitors to Belgium (18 % of intra-EU inbound trips) and Czechia (16 %), Denmark (13 %) and Germany (11 %), while buses were relatively significant (at least 10 %) for intra-EU trips to Czechia, Latvia and Slovenia.
Over 2 out of 3 intra-EU tourism nights are spent in rented tourist accommodation
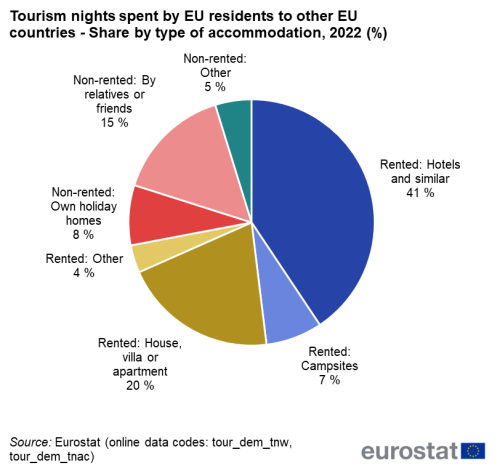
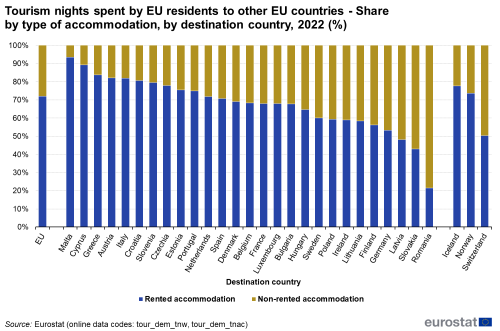
In 2022, EU residents spent 1.5 billion tourism nights during their trips to other EU countries. Over 2 out of 3 (72.0 %) of those nights were spent in rented tourist accommodation establishments (see Figure 4). Hotels or similar accommodation providing services such as daily cleaning and bed-making came on top with 41 %, while 20 % of all intra-EU tourism nights were spent at a house, villa or apartment and 7 % in campsites (including caravan or trailer parks). The remaining 4 % were spent in other types of rented accommodation (e.g. youth hostel, mountain hut).
Looking at non-rented accommodation, own holiday homes accounted for 8 % of all intra-EU tourism nights and accommodation provided for free by friends or relatives for 15 %.
Across the EU, the significance of rented and non-rented accommodation for inbound visitors was quite contrasting, with the share of rented accommodation ranging from 93 % of all EU residents’ tourism nights in Malta to 21 % of those spent in Romania (see Figure 5).
More than 1 in 4 intra-EU trips are made in July and August
Looking at the breakdown by month of departure of trips, August (14.7 %) and July (13.0 %) accounted for more than one out of four trips, while January represented only 2.9 % of intra-EU trips in 2022 (see Table 2).
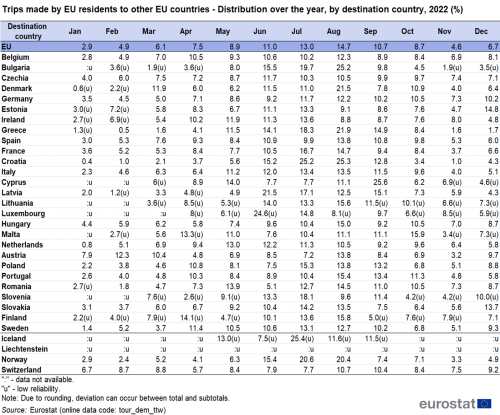
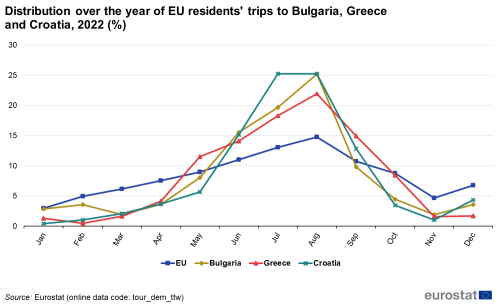
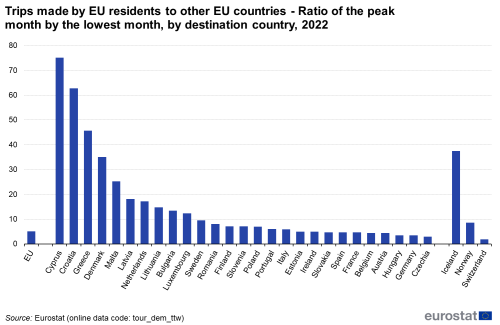
Seasonality of inbound trips by visitors coming from other EU countries was particularly high in Croatia, where more than half of all inbound trips (50.5 %) took place during the two core summer months, July and August. In Bulgaria the share of these two months was 44.9 %, followed by Greece (40.3 %) (see Figure 6). In Cyprus, the number of trips made by EU visitors in the peak month was 75 times higher than the lowest month, while this ratio was 63 to one for Croatia and 46 to one for Greece. The lowest seasonality was recorded in Czechia followed by Germany and Hungary; in these countries the number of intra-EU inbound trips during the peak month was less than 4 times higher compared with the lowest month (see Figure 7).
Cruise ships popular for trips to Estonia and Sweden
Looking at the segment of trips for holidays, leisure and recreation and at the features of the destination that attracted tourists, seaside was reported as one of the attractions for 39 % of intra-EU holiday trips of Europeans in 2022. City tourism was a relevant feature for 37 % of the trips, while countryside and mountains were reported as one of the attractions for 19 % of the trips (see Table 3) (see chapter “Data sources”).
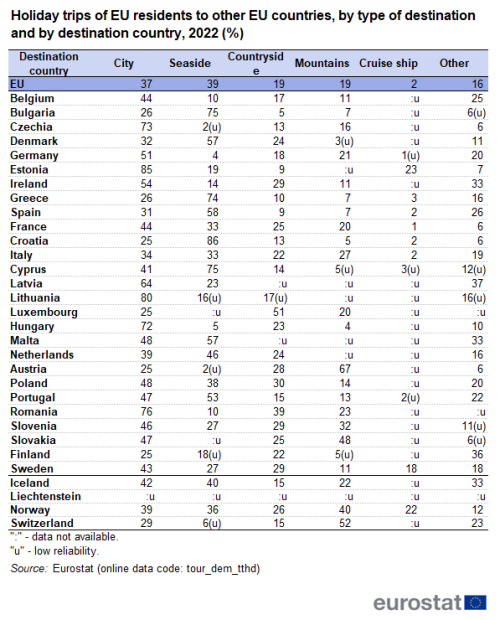
Looking at national data, city tourism was the most frequently reported feature for most countries, followed closely by seaside. Cities were reported as an attraction for at least two out of three holiday trips to Estonia (85 %), Lithuania (80 %), Romania (76 %), Czechia (73 %) and Hungary (72 %).
Seaside attracted European tourists for at least two out of three of their holiday trips to Croatia (86 %), Bulgaria and Cyprus (both at 75 %) and Greece (74 %).
In nine countries, the countryside was an attraction for at least one out of four inbound holiday trips: Luxembourg (51 %), Romania (39 %), Poland (30 %), Ireland, Slovenia and Sweden (each at 29 %), Austria (28 %), France and Slovakia (both at 25 %). Europeans reported the mountains as one of the attractions for 67 % of their holiday trips to Austria.
Cruise ships in the Baltic sea were one of the most frequently reported attractions for European tourists to Estonia (23 %) and Sweden (18 %). These were also among the countries with the highest shares of inbound trips with waterway as main mode of transport.
Source data for tables and graphs
Data sources
Collection of annual data on trips of EU residents
The collection consists of harmonised data collected by the Member States in the frame of the Regulation (EU) No 692/2011 of the European Parliament and of the Council concerning European statistics on tourism.
The scope of observation for data on tourism trips are all tourism trips with at least one overnight stay, made by the resident population aged 15 and over. It includes trips made for private or professional purpose, outside the usual environment.
Data on type of destination is sent to Eurostat every three years. This article includes data for the reference year 2022. Next transmission will take place in 2026 for the reference year 2025. For this variable, multiple answer possibilities are allowed. In case of a trip involving several destinations, it should refer to the entire trip and not only to the main destination of the trip.
Context
The EU is a major tourist destination, with four Member States among the world’s top ten destinations for holidaymakers, according to UNWTO[1] data. Tourism is an important activity in the EU which has the potential to contribute towards employment and economic growth, as well as to development in rural, peripheral or less-developed areas. These characteristics drive the demand for reliable and harmonised statistics within this field, as well as within the wider context of regional policy and sustainable development policy areas.

