Gross domestic expenditure on R&D
Gross domestic expenditure on R&D (GERD) stood at €355 billion in the EU in 2022, which equated to an average of €794 of R&D expenditure per inhabitant. There was an increase of 7 % on the year before, and there was an increase of 47.5 % compared with 10 years earlier, in 2012 — note that these rates of change are in current prices and so reflect price changes as well as real changes in the level of expenditure.
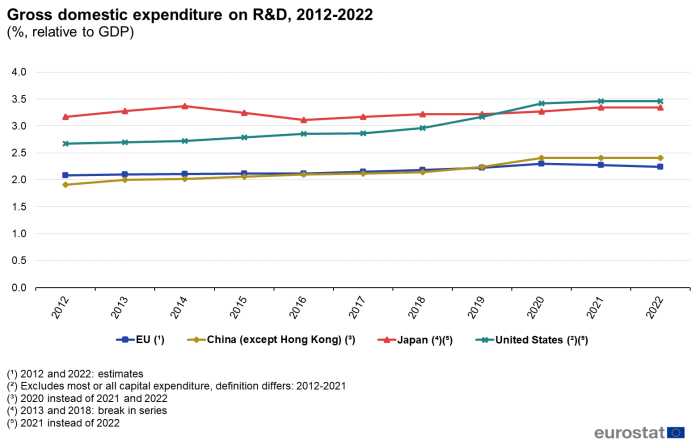
In order to make figures more comparable, GERD is often expressed relative to GDP — see Figure 1 — or in relation to population. The ratio of GERD to GDP is also known as R&D intensity. This ratio increased modestly in the EU during the period from 2012 to 2022, rising from 2.08 % in 2012 to 2.30 % in 2020, decreasing in 2022 to 2.23.
The negative variation in R&D intensity between 2020 and 2022 could be explained by the GDP rebound in 2021 after the significant drop in 2020 as a result of the COVID-19 pandemic. Comparing with the situation before the COVID crisis, both GERD and R&D expenditure per inhabitant are now clearly higher than in 2019: the GERD in 2022 was €355 billion, while in 2019 was €312 billion; and the R&D expenditure per inhabitant in 2022 was €794, while in 2019 was €698.
Despite these increases, the EU’s R&D expenditure relative to GDP remained well below the corresponding ratios recorded in Japan (3.34 %, 2021 data) and the United States (3.46 %, 2021 data), as has been the case for a lengthy period of time. On the other hand, R&D intensity in China came closer to that of the EU in 2012-2018, and in 2019 Chinese R&D expenditure was equivalent to 2.24 % of GDP, while the R&D intensity of the EU in 2019 was 2.22. In 2020, the Chinese expenditure stood at 2.41 %.
Between 2012 and 2022, R&D intensity within the Japanese economy fluctuated, with its ratio of R&D expenditure to GDP starting at 3.17 % in 2012, then ranging to 3.37 % (in 2014) and back to 3.11 % in 2016 and finishing at 3.34 % in 2022. In 2012, the R&D intensity in the United States was 2.67 %. In 2013 the R&D intensity in the United States started to grow, reaching 3.46 % by 2021. China’s R&D intensity increased more rapidly than for the EU and Japan as shown in Figure 1, rising from 1.91 % in 2012 to 2.41 % by 2020, an increase of 0.5 percentage points (pp).
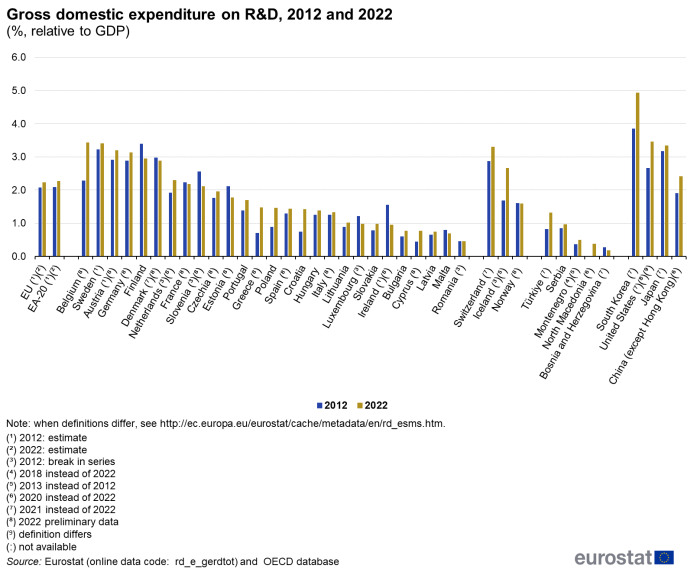
Among the EU Member States, the highest R&D intensity in 2022 was recorded in Belgium (3.44 %), Sweden (3.40 %) followed by Austria (3.20 %) — see Figure 2. The next highest ratios were recorded in Germany (3.13 %) and in Finland (2.95 %). There were eight Member States that reported R&D expenditure that was below 1 % of their GDP in 2022; each of these were Member States that joined the EU in 2004 or more recently, with the lowest R&D intensities recorded in Romania (0.46 %), Malta (0.65 %) and Latvia (0.75 %).
Most EU Member States (more than two-thirds) reported a higher intensity in 2022 than in 2012. However, the most significant decreases in R&D intensity took place in Ireland (-0.60 pp), Finland (-0.45 pp), Estonia (-0.35 pp) and Slovenia (-0.30 pp). At the other end of the range, the biggest increases in R&D intensity (in percentage point terms) between 2012 and 2022 were recorded in Belgium (1.16 pp), Greece (0.77 pp), Croatia (0.69 pp), Poland (0.57 pp), the Netherlands (0.38 pp), Portugal and Cyprus (both with 0.33 pp).
R&D expenditure by sector of performance
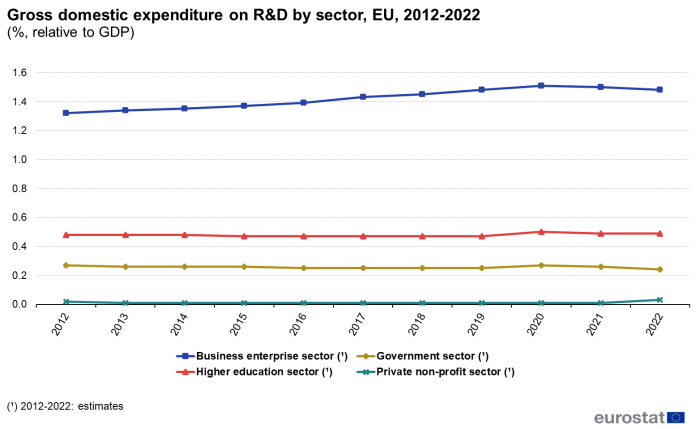
Figure 3 shows how the EU’s R&D intensity changed between 2012 and 2022 in each of the four sectors of performance: the Business enterprise sector, the Government sector, the Higher education sector and the Private non-profit sector. Throughout this period, the majority of R&D expenditure was performed in the business enterprise sector, and its R&D expenditure rose from 1.32 % of GDP in 2012 to 1.48 % by 2022, an overall increase of 12.12 %. The second largest sector performing R&D was the higher education sector, whose R&D intensity remained mostly stable between 2012 and 2022, with few fluctuations during this period and reaching 0.48 % of GDP both in 2012 and 2022. The R&D intensities of the two other sectors changed little over the period under consideration: in 2022 the R&D intensity of the government sector was 0.24 % of GDP, a small decrease from 0.27 % in 2012; and for the private non-profit sector it was 0.02 % of GDP in 2012 and a small increase to 0.03 % of GDP in 2022.
(%, relative to GDP)
Source: Eurostat (rd_e_gerdtot) and OECD database
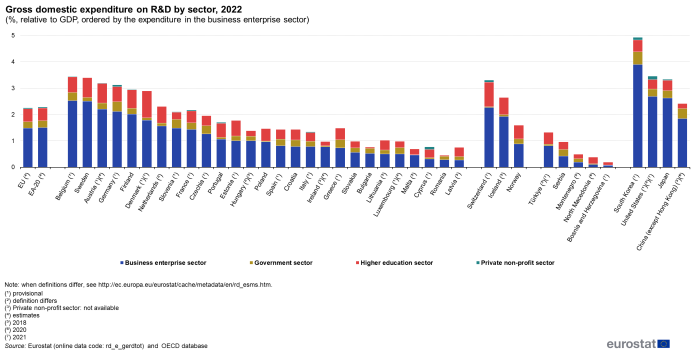
The differences in the relative significance of R&D expenditure between countries are often explained in part by levels of expenditure within the business enterprise sector as can be seen in Figure 4. While R&D expenditure in the EU’s business enterprise sector was equivalent to 1.48 % of GDP in 2022, this ratio reached 3.90 % in South Korea, 2.68 % in the United States, 2.62 % in Japan and 2.26 % in Switzerland (2021 data for all these economies apart from the EU). The relative significance of R&D expenditure in the government and higher education sectors was broadly similar in the EU and across all of these non-member countries, except for Switzerland where the government sector’s R&D intensity was close to zero and that of the higher education sector was relatively high. In South Korea, (2021 data), the share of the government sector rose to 0.48 %, 0.24 pp higher than the EU.
An evaluation of the data of the EU Member States also confirms that those which had relatively high ratios of business enterprise expenditure on R&D relative to GDP — namely, Belgium (2.53 %), Sweden (2.51 %), Austria (2.20 %), Germany (2.11 %), Finland (2.01 %) and Denmark (1.78 %) — also reported relatively high overall R&D intensities. Denmark, Sweden, Austria and Finland also featured at the top of the ranking of expenditure in the higher education sector. Government R&D expenditure relative to GDP was highest in Germany, Slovenia, Belgium, Czechia and Greece, while private non-profit sector R&D expenditure relative to GDP was very low in all Member States, peaking at 0.10 % in Cyprus.
Source: Eurostat (rd_e_gerdtot) and OECD database
R&D expenditure by source of funds
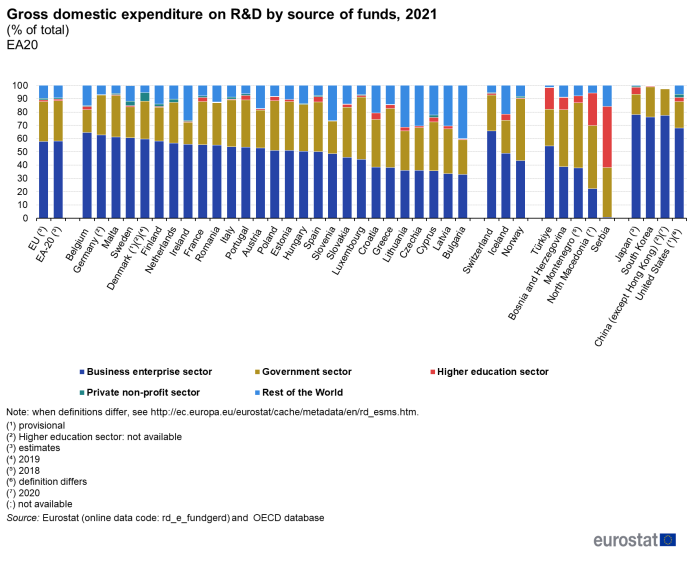
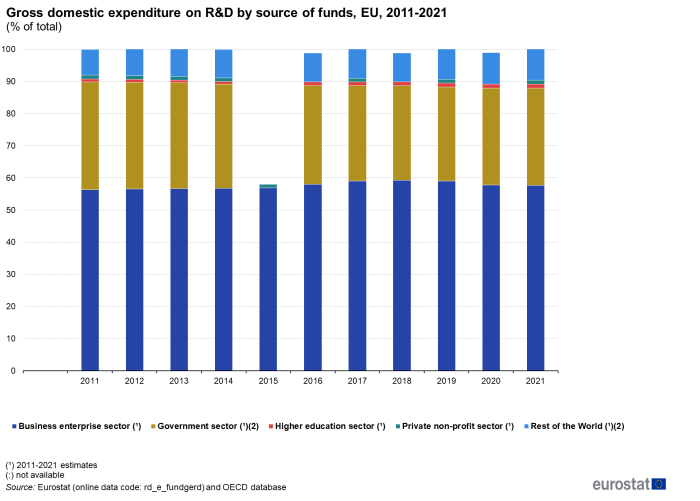
An analysis of R&D expenditure by source of funds shows that more than half (57.7 %) of the total expenditure within the EU in 2021 was funded by business enterprises, while almost one-third (30.3 %) was funded by government, and a further 9.7 % from the rest of the world (foreign funds). Funding by the higher education sector was relatively small in 2021, 1.2 % of the total, see Figure 5. The main developments over the period 2011 to 2021 were a fall in the share of funding by the government sector, with a small increase in 2020 and then in 2021 to 30.3 %. For the higher education sector there was a small increase, while the private non-profit sector did not change and the rest of the world increased by 1.7 pp.
(% of total)
Source: Eurostat (rd_e_fundgerd) and OECD database
In 2021, business-funded R&D accounted for more than three-fifths of total R&D expenditure in Belgium (64.4 %), Germany (62.8 %), Malta (61.3 %) and Sweden (60.7 %). By contrast, an important part of the expenditure on R&D in Luxembourg (47.0 %), Greece (44.5 %), Slovakia (37.9 %), Spain (37.5 %), Poland (37.4 %), Estonia (37.0 %), Cyprus (36.7 %) and Croatia (35.9 %) was funded by the government sector. There were also considerable differences in the relative significance of R&D funding from the rest of the world, with relatively high shares in 2021 reported in Bulgaria (40.1 %), Lithuania (31.3 %), Czechia (30.5 %), Latvia (30.4 %), Slovenia (26.4 %) and Ireland (26.3 %). The Higher education (HES) sector played a relatively small role in funding R&D expenditure in most Member States, exceeding 3.0 % in the southern Member States of Croatia (4.8 %), Spain (4.0 %), Cyprus (3.4 %) and Portugal (3.3 %), in addition also in Poland (3.1 %), and being modest in the rest of the Member States. Equally, the role of the private non-profit sector was also generally small, exceeding 3.0 % in Denmark (6.3 %) and in Sweden (3.3 %) while being very modest in the rest of the Member States.
In Japan (78.1 %), China (77.5 %, 2020 data) and South Korea (76.2 %), business-funded R&D accounted for a larger share of total R&D expenditure than in the EU. In the Asian economies under review here the share of business-funded R&D was over three-quarters of the total R&D in 2021. In the United States (67.9 %), the share of business-funded R&D was lower than in Asia, but remained higher than the EU average (see Figure 6).
Source data for tables and figures (MS Excel)
Data sources
Statistics on science, technology and innovation were collected based on Commission Implementing Regulation (EU) Regulation (EU) No 995/2012 concerning the production and development of Community statistics on science and technology until the end of 2020. Since the beginning of 2021, the collection of R&D statistics is based on Commission Implementing Regulation (EU) No 1197/2020 of 30 July 2020. Please note that according to Article 12(4) of Regulation (EU) 2020/1197, the provisions of Regulation (EU) 995/2012 continue to apply for the reference years that fall before 1 January 2021.
Eurostat’s statistics on R&D expenditure are compiled using guidelines laid out in the Frascati manual 2015, published in 2015 by the OECD. The manual was updated to improve guidelines reflecting changes in the way that R&D is funded and carried out in globalised economies, for example, with new sections covering the different aspects of public support for R&D (such as tax incentives). Acknowledgement: OECD data has been used for Japan, South Korea, US and China.
R&D expenditure is a basic measure that covers intramural expenditure, in other words, all expenditures for R&D that are performed within a statistical unit or sector of the economy in the EU Member States. The main analysis of R&D statistics is by four institutional sectors of performance. These four sectors are: the business enterprise sector, the government sector, the higher education sector and the private non-profit sector. Gross domestic expenditure on R&D (GERD) is composed of expenditure in each of these four sectors. Expenditure data covers the research performed on the national territory, regardless of the source of funds; data are usually expressed in relation to GDP and this ratio is often referred to as R&D intensity. Additional analyses of R&D expenditure are available by: source of funds (for which data are also available from a fifth sector, funding from the rest of the world); field of R&D (FORD); type of costs; economic activity (NACE); enterprise size class; type of R&D; socioeconomic objectives; and regions (NUTS).
Context
One area that has received considerable attention in recent years is the structural difference in R&D funding between Europe and its main competitors. Policymakers in Europe have tried to increase R&D business expenditure so that it is more in line with relative contributions observed in Japan or the United States. The European Research Area (ERA) is designed to overcome some of the barriers that are thought to have hampered European research efforts, for example, by addressing geographical, institutional, disciplinary and sectoral boundaries. In September 2020, the European Commission published a communication on A new ERA for Research and Innovation (COM(2020) 628 final). This highlighted that the EU faces several challenges, aggravated by the COVID-19 crisis, and that the ERA has a key role to play in addressing these challenges. It noted that, although the EU is still a global leader in research and innovation, its performance had stagnated in recent years.
Some other countries, particularly from Asia, have increased in significance in terms of research and innovation, and more broadly in their use of technology. Drawing on the lessons from the COVID-19 crisis, the communication proposes to strengthen that the ERA needs to reinforce research and innovation. Underlying these goals are not only the issues of prosperity and economic competitiveness, but also the EU’s autonomy. The communication reaffirmed the commitment to the ERA and proposed a ‘new approach in order to accelerate Europe’s green and digital transformation, strengthen Europe’s resilience and preparedness to face future crises, and to support Europe’s competitive edge in the global race for knowledge’.
The EU’s framework programmes for research have, since their launch in 1984, played a leading role in multidisciplinary research activities. In December 2020, political agreement was reached on the proposals for Horizon Europe, the EU’s 9th framework programme for research and innovation for 2021 to 2027 with a budget of €95.5 billion; this programme carries on from Horizon 2020. The first Horizon Europe Strategic Plan covers the period from 2021 to 2024. The European Commission has started preparations for the implementation of Horizon Europe, based on three pillars:
- excellent science supporting frontier research projects;
- global challenges and European industrial competitiveness that reinforces technological and industrial capacities and sets EU-wide missions with ambitious goals tackling some of society’s biggest issues (health, climate change, clean energy, mobility, security, digital, materials);
- innovative Europe designed to make Europe a frontrunner in innovation and SME growth through the creation of a European Innovation Council (a one-stop shop to help innovators create future markets, supporting innovations that have a breakthrough or disruptive nature).
Within Horizon Europe, five European mission areas have been identified with the aim of increasing the effectiveness of funding by pursuing clearly defined targets:
- adaptation to climate change including societal transformation;
- cancer;
- climate-neutral and smart cities;
- healthy oceans, seas, coastal and inland waters;
- soil health and food.
The missions and the entire programme facilitates collaboration and strengthens the impact of research and innovation in developing, supporting and implementing EU policies while tackling global challenges. It supports creating and better dispersing of excellent knowledge and technologies.

