14 million fewer Europeans made tourism trips in 2022 compared with 2019
In recent decades, tourism trips have become an important aspect of the lives of many Europeans. Tourism gives people the opportunity to break out from their usual environment and discover other parts of their own country, other countries in Europe or other regions of the world. Tourism thus helps to bring people from different cultures together and fosters mutual respect between different communities within and across countries or continents.
In 2020, the outbreak of Covid-19 had an unprecedented impact on travel behaviour of people all around the world due to the related measures put in place in all countries worldwide, and the perceived health risk and uncertainty of people to travel. In 2021, many of the restrictions were lifted, allowing the tourism sector to start recovering.
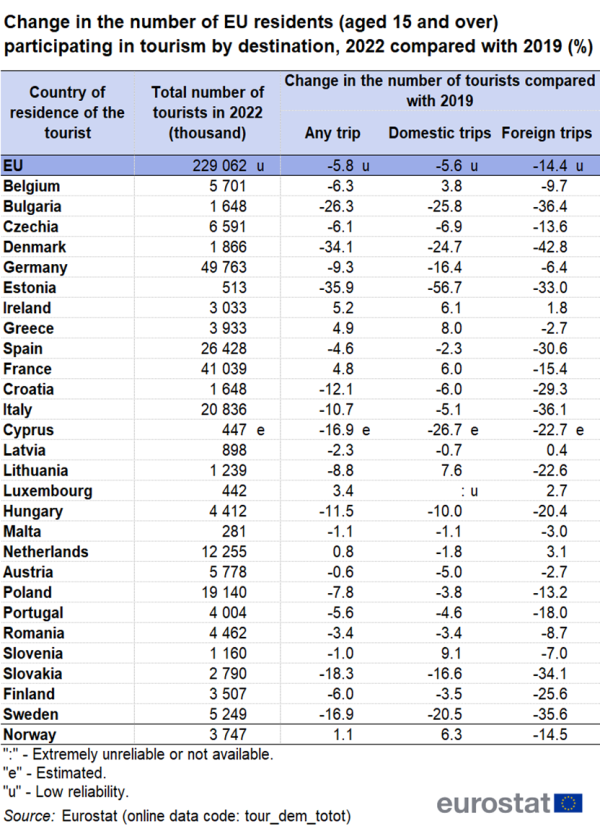
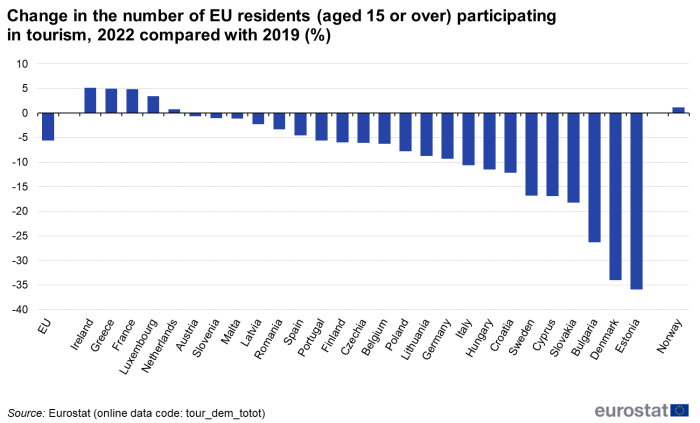
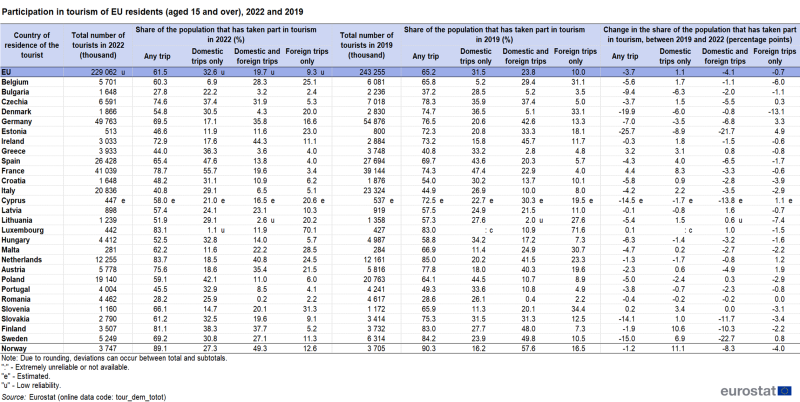
Nearly 230 million Europeans (aged 15 years and over) participated in tourism in 2022, making at least one tourism trip for personal purposes (see Table 1). This represents a drop of 6 % (or 14 million fewer tourists) compared with 2019, but an increase of 10 % (or 20 million more tourists) compared with 2021. Five countries exceeded 2019 levels, namely Ireland, Greece and France (+5 % each), Luxembourg (+3 %) and the Netherlands (+1 %), while the highest drops were recorded in Estonia (-36 %), Denmark (-34 %) and Bulgaria (-26 %) (see Figure 1).
(%)
Source: Eurostat (tour_dem_totot)
(%)
Source: Eurostat (tour_dem_totot)
Looking closer at the destination of the trip, 14 % fewer Europeans travelled abroad in 2022 compared with 2019. This drop at EU level reflects decreases in all but four EU countries: Ireland, Latvia, Luxembourg and the Netherlands. The largest drops of more than 35 % were registered in Bulgaria, Denmark, Italy and Sweden, while the lowest decreases in the number of tourists travelling abroad were for residents of Greece, Malta and Austria (-3 % each) (see Table 1).
Domestic tourism has also been affected by the Covid-19 pandemic, with 6 % fewer Europeans having made trips inside their own country in 2022 compared with 2019. However, the impact was less dramatic than on international tourism, since during the pandemic there has been a slight shift towards domestic tourism. More residents of Belgium, Ireland, Greece, France, Lithuania and Slovenia made domestic trips in 2022 compared with 2019. All other countries, however, also saw a decline in the number of domestic tourists, with Estonia reporting the largest drop (-57 %).
More than six in ten EU residents made tourism trips in 2022
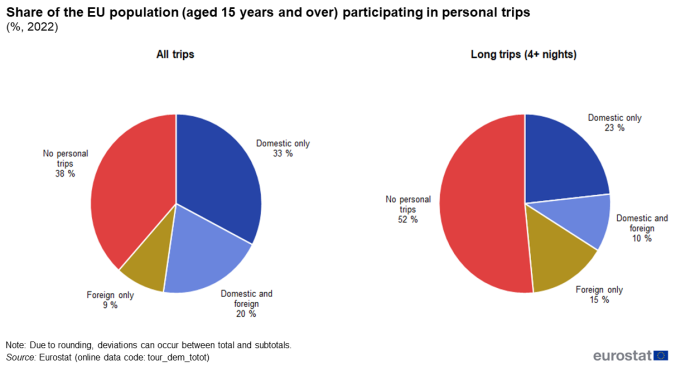
This subpopulation of tourists (not including business trips) of nearly 230 million Europeans who made at least one tourism trip for personal purposes in 2022 corresponds to more than half (62 %) of the EU population (aged 15 years and over). One third (33 %) of Europeans made at least one domestic tourism trip with at least one overnight stay and no trips abroad, while only 9 % made at least one trip abroad and no domestic trips. However, one fifth of the Europeans made domestic trips as well as foreign trips (see Figure 2).
When only trips of at least four overnight stays are taken into account — thus excluding tourists whose trips lasted no more than three nights — the participation rate drops to 48 % (see pie chart on the right of Figure 2).
(%)
Source: Eurostat (tour_dem_totot)
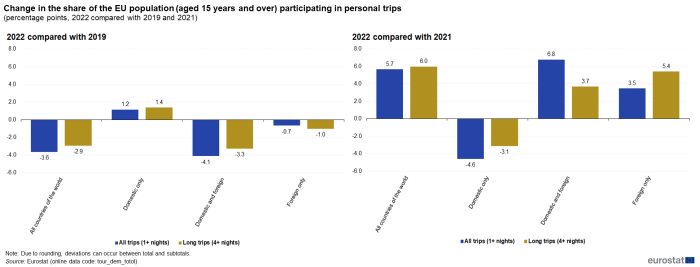
Figure 3 shows the change in the shares of participation in tourism in 2022 compared with the pre-Covid year 2019. The share of the EU population participating in tourism, regardless of the destination, dropped by 4 percentage points (pp) for trips with at least one overnight stay and by 3 pp for long trips of at least four overnight stays.
The analysis in the first chapter shows a drop in the number of domestic tourists, those who made at least one trip inside their own country, independently of whether they also travelled abroad or not. Looking closer at Europeans who made only domestic and no foreign trips, the share of participation was higher in 2022 compared with 2019, with +1 % both for all trips and for the segment of long trips. More than half of the European tourists made only domestic trips in 2022. However, compared with 2021, the share of participation only in domestic trips dropped by 5 % for all trips and by 3 % for the segment of long trips, while the share increased for people having participated in both domestic and international trips or in international trips only.
Source: Eurostat (tour_dem_totot)
In 2022 participation of Europeans in tourism ranged from 84 % in the Netherlands to 28 % in Bulgaria and Romania
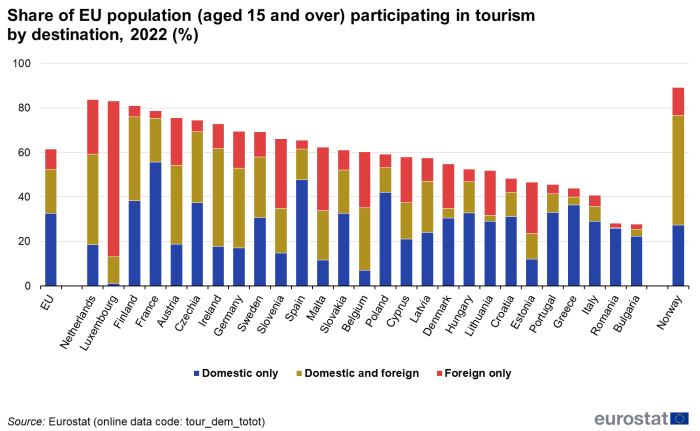
In seven Member States, at least seven out of ten residents made at least one tourism trip for personal purposes in 2022: the Netherlands (84 %), Luxembourg (83 %), Finland (81 %), France (79 %), Austria (76 %), Czechia (75 %) and Ireland (73 %) (see Table 2 and Figure 4). At the other end, less than three out of ten residents of Bulgaria and Romania (28 % each) participated in tourism. In 2019, the share of persons participating in tourism ranged from 29 % in Romania to 85 % in the Netherlands.
Source: Eurostat (tour_dem_totot)
(%)
Source: Eurostat (tour_dem_totot)
In the two largest Member States in terms of population, Germany and France, the participation rate was higher than the EU average (69 % and 79 %, respectively); together they accounted for four out of ten European tourists.
Countries with the highest participation rates in domestic tourism (namely “domestic trips only” plus “domestic and foreign trips”) were Finland (76 %), France (75 %), Czechia (69 %), Ireland (62 %) and Spain (61 %). As regards foreign tourism, the highest participation rates were observed among residents of Luxembourg (82 %), followed at some distance by the Netherlands (65 %), Austria (57 %) and Ireland (55 %).
Countries whose populations made the highest proportion of domestic trips only (and no foreign trips) during 2022 were France (56 %), Spain (48 %) and Poland (42 %).
More than half of the Europeans aged 65 years and over did not make any trips in 2022
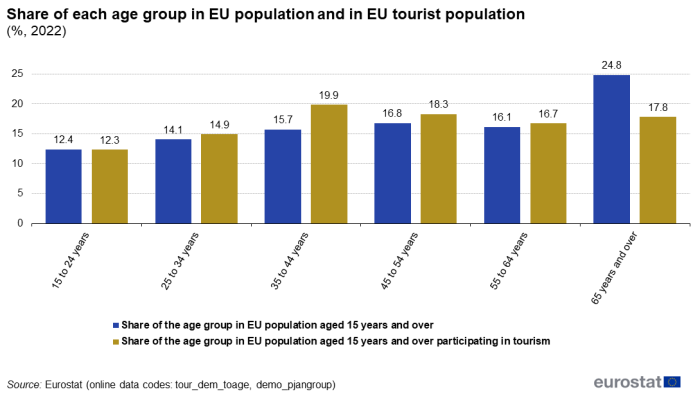
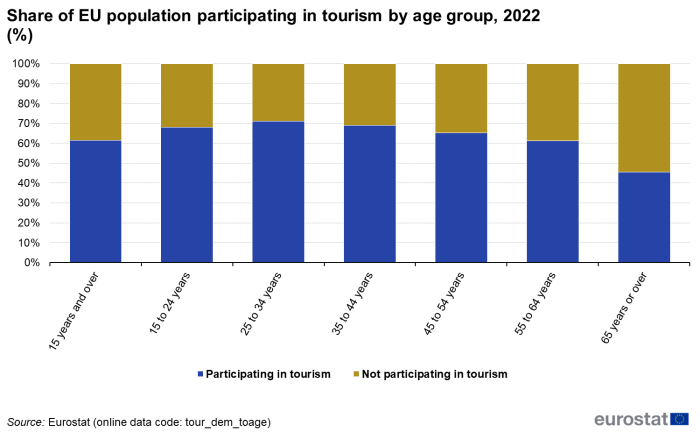
On average, 62 % of the EU population made tourism trips for personal purposes in the course of 2022. The participation rate ranged between 61 % and 71 % in all age groups except for those aged 65 years and over, where it dropped to 46 % (see Figure 5). While persons aged 65 years and over represented 25 % of the EU population aged 15 years and over, they accounted for only 18 % of EU tourists (see Figure 6). However, even with a low share of participation in tourism, this age group of 65 years and over represented nearly 41 million tourists. Compared with 2019, participation in tourism dropped for all age groups in 2022 but one, ranging from -18 % for Europeans aged 15 to 24 years to -2 % for those aged 45 to 54 years. The only exception corresponded to Europeans aged 35 to 44 years, who recorded an increase of +5 % (see Figure 7).
(%)
Source: Eurostat (tour_dem_toage)
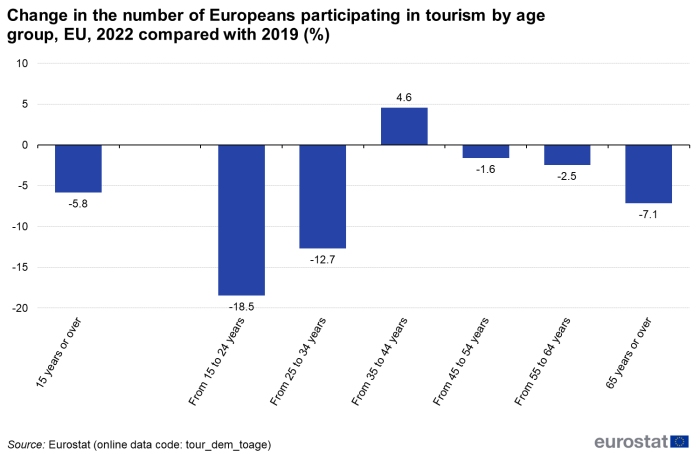
(%)
Source: Eurostat (tour_dem_toage)
In 2022, half of the European tourists made only domestic trips
This section looks closer at the segment of the EU population who made tourism trips and the breakdown by destination of those trips. More than half (53 %) of the EU tourists made only domestic trips in 2022, an increase compared with 2019 when this share was 48 % (see Figure 8). Considering tourists who made both domestic and foreign trips, eight out of ten EU tourists made at least one domestic trip in 2022.
The pattern was fairly stable across all age groups for domestic trips. 40 % of tourists aged 65 years and over made foreign trips while for the other age groups this share ranged from 45 % to 54 % of their tourist population (see Figure 9).
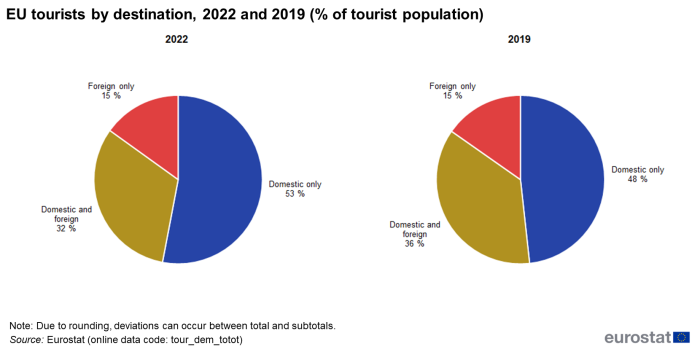
(% of tourist population)
Source: Eurostat (tour_dem_totot)
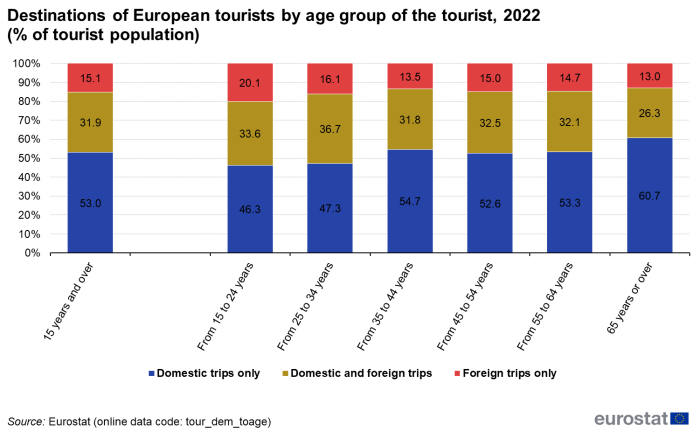
(% of tourist population)
Source: Eurostat (tour_dem_toage)
Two out of five Europeans who did not make tourism trips mentioned financial reasons
Data on reasons for not participating in tourism is sent to Eurostat every three years. In this article we present data for the reference year 2022. New data will be available in 2026 for the reference year 2025.
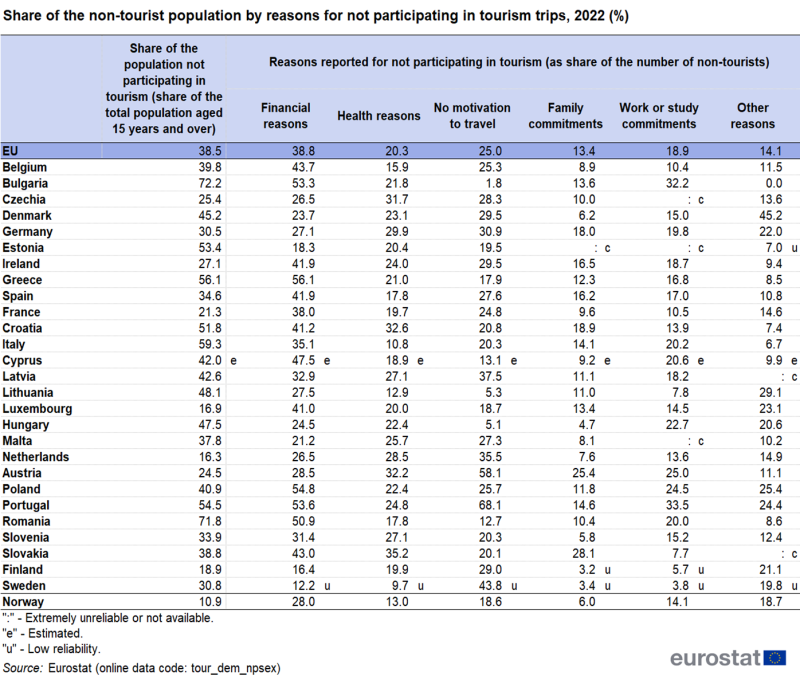
In 2022, nearly two out of five (39 %) Europeans who did not participate in tourism reported financial reasons as one of the main reasons (see Table 3 and Figure 10) – please note that respondents could report more than one reason. 25 % of non-tourists mentioned no motivation to travel as one of the main reasons for not taking holidays, while another 20 % mentioned health reasons. Work or study commitments was mentioned by 19 % of the European non-tourists for not participating in tourism while 13 % mentioned family commitments.
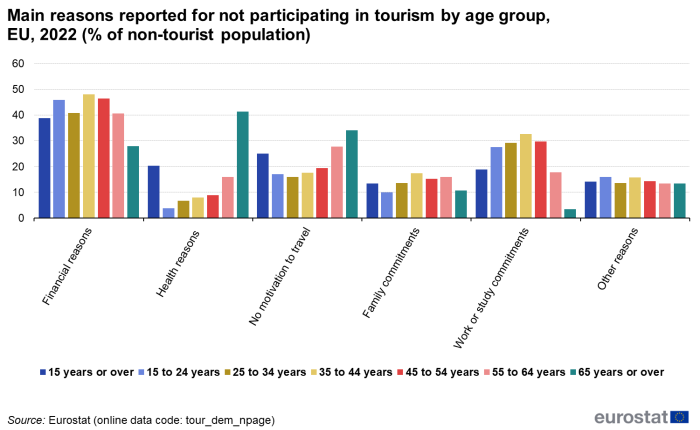
(% of non-tourist population)
Source: Eurostat (tour_dem_npage)
(%)
Source: Eurostat (tour_dem_npsex)
Looking at country level, financial reasons as one of the main reasons for not participating in tourism was the most frequently reported reason in the majority of the Member States. This was the main reason mentioned by more than half of the non-tourists in Bulgaria, Greece, Poland, Portugal and Romania. However, in Latvia, Malta, the Netherlands, Austria, Portugal, Finland and Sweden the most frequent reason for not participating in tourism was not of a financial nature, but rather a lack of interest or motivation to travel. In Czechia and Estonia health issues tended to be the main reason to stay at home.
When looking at the differences by age, financial aspects are the main obstacle to taking part in tourism for all age groups except for the age group 65 years and over for which health reasons are the most frequently mentioned barrier (41 % of this age group did not travel for health reasons, compared with – on average – 9 % in the other age groups).
In 2022, nearly 3 out of 10 Europeans could not afford to pay for one week of holidays
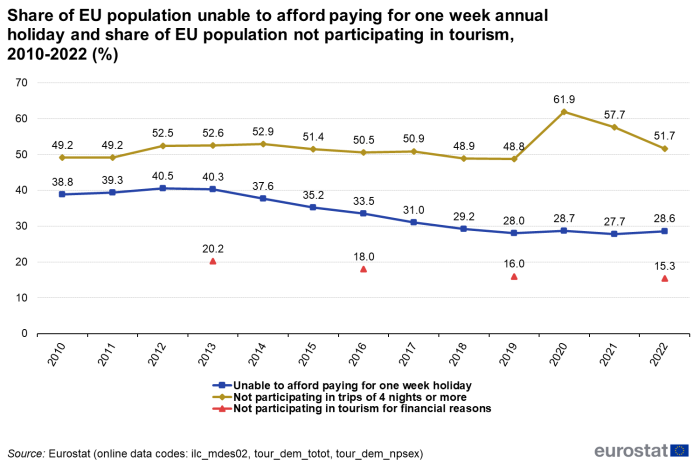
The collection of data on reasons for not participating in tourism started in 2014 with 2013 as first reference year. This data is sent to Eurostat every three years. In 2013, 20 % of all EU residents aged 15 years and over reported financial issues as one of the main reasons for not participating in tourism. This share dropped to 18 % in 2016 and decreased further to 16 % in 2019, reaching 15 % in 2022.
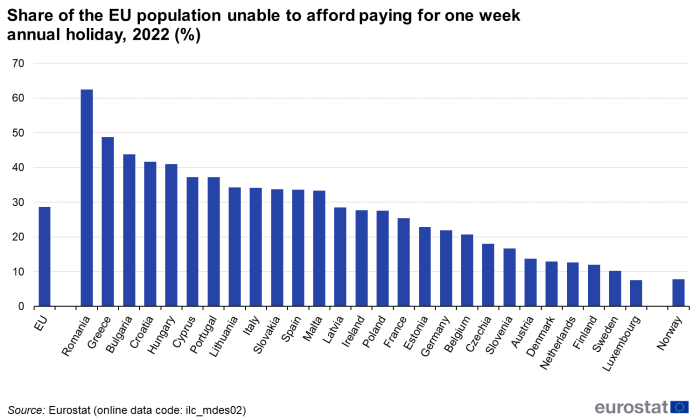
The statistics on income and living conditions, however, include an indicator related to tourism which gives the proportion of the population that cannot afford to pay for one week of annual holiday away from home during the reference year (see Figure 11 and Figure 12). After a peak of 40.5 % in 2012 due to the economic crisis, this proportion started decreasing in 2013 and reached 28.0 % in 2019. In 2020, the share of Europeans who could not afford one week of annual holidays increased again to 28.7 % and then decreased to 27.7 % in 2021. In 2022 it increased again to 28.6 %, ranging from 8 % in Luxembourg to more than 40 % in Romania, Greece, Bulgaria, Croatia and Hungary.
The data on participation in tourism shows that the share of EU residents aged 15 years and over that did not participate in any trips of at least four overnight stays remained more or less stable during the ten-year period 2010-2019, ranging from 48.8 % in 2019 to 52.9 % in 2014, but increased sharply to 61.9 % in 2020. A decrease followed in 2021, reaching 57.7 % and continued further in 2022, reaching 51.7 %. This data looks at Europeans who did not make any long trips, independently of the reason for not travelling; it reflects, however, the impact of Covid-19 in 2020 and the slow recovery in 2021. Given the relatively stable share of the population that cannot afford to pay for one week of annual holiday away from home in 2020 and 2021, the lower participation during these years tends to be mainly due to other reasons than financial ones (for example, health reasons, Covid-19 restrictions, no motivation to travel, etc.).
(%)
Source: Eurostat (ilc_mdes02), (tour_dem_totot), (tour_dem_npsex)
(%)
Source: Eurostat (ilc_mdes02)
Source data for tables and graphs
Data sources
Collection of annual data on trips of EU residents
The collection consists of harmonised data collected by the Member States in the frame of the Regulation (EU) No 692/2011 of the European Parliament and of the Council concerning European statistics on tourism.
The scope of observation for the data on participation in tourism are the residents of the country, aged 15 years and over, and refers only to tourism for personal purposes, excluding trips made for professional reasons.
The scope of observation for the data on quality of life, in particular the inability to afford to pay for one-week annual holiday away from home, are all persons living in private households, excluding in general the persons living in collective households and in institutions from the target population.
Context
The EU is a major tourist destination, with four Member States among the world’s top ten destinations for holidaymakers, according to UNWTO[1] data. Tourism is an important activity in the EU which has the potential to contribute towards employment and economic growth, as well as to development in rural, peripheral or less-developed areas. These characteristics drive the demand for reliable and harmonised statistics within this field, as well as within the wider context of regional policy and sustainable development policy areas.

