General overview
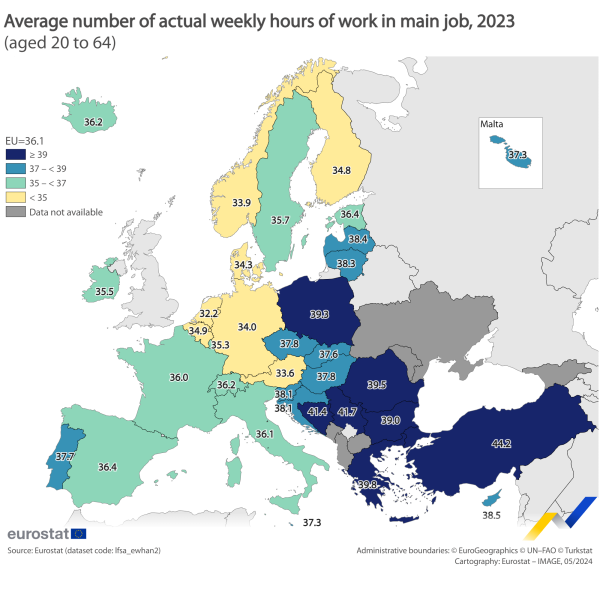
In the EU, in 2023, people aged 20-64 years in employment worked 36.1 hours on average per week. This number refers to the hours people actually worked in their main job in the reference week (see methodological notes for the difference between actual and usual hours of work).
The average actual working hours per week differ between EU countries (see Map 1). Those with the longest working week were Greece (39.8 hours), Romania (39.5), Poland (39.3) and Bulgaria (39.0).
By contrast, the Netherlands had the shortest working week (32.2 hours), followed by Austria (33.6) and Germany (34.0).
Source: Eurostat (lfsa_ewhan2)
Employed people by the average actual working hours in a week
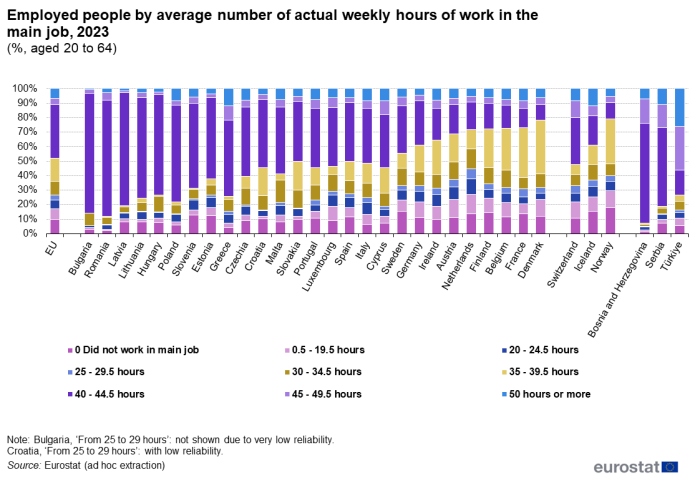
In the EU, in 2023, 37.1 % of employed people worked on average between 40 and 44.5 hours in a week, whilst only 7.1 % recorded less than 20 actual hours of work per week, in the main job (see Figure 1). The 40-44.5 range of actual working hours represents the largest share in most countries – except for Ireland, Finland, Belgium, France and Denmark, where the greatest share of employed people was for the range of 35-39.5 average worked hours per week.
The same range of hours (40 to 44.5) also shows the greatest differences across countries. Indeed, the largest shares were recorded in Bulgaria (82.2 %), Romania (80.2 %) and Latvia (77.7 %). The lowest shares were found in Belgium (16.1 %), France (13.3 %) and Denmark (10.6 %).
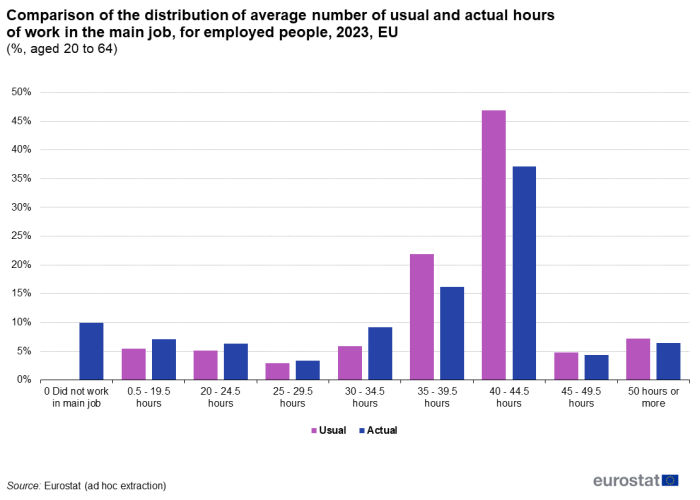
When comparing the distribution of usual and actual hours of work across employed people, in the main job, it emerges that usual worked hours are considerably higher than actual worked hours, for the range of weekly working hours of 35-39.5 and 40-44.5 (see Figure 2). The greatest difference (9.8 percentage points) at EU level regarded those who worked 40 to 44.5 hours on a weekly basis (46.9 % of usual hours and 37.1 % of actual hours). This is explained by the fact that usual working hours are not affected by any absence from work while actual working hours in the reference week may be affected by holidays, sick leave or other kinds of absences.
By contrast, in the working hours’ ranges comprised between 0.5 and 34.5 hours of work, there are less usual worked hours than actual worked hours for employed people. This could be explained by the willingness for those usually working few hours to work more hours.
Patterns in average actual working week: by full-time and part-time workers and sex
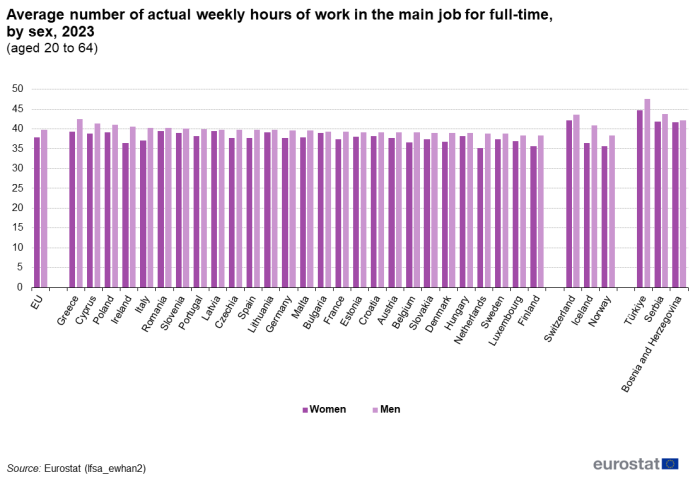
In the EU, in 2023, men who were employed full time worked 39.8 hours weekly, compared to 37.8 hours for women in the same group (see Figure 3). For women, the longest working week was found in Romania (39.5 hours), Latvia (39.4) and Greece (39.3). The shortest working week was detected in Netherlands (35.2 hours), Finland (35.7) and Ireland (36.5).
As for men, 7 EU countries show a working week longer than 40 hours on average, in particular Greece (42.5 hours per week), Cyprus (41.3) and Poland (41.1). On the contrary, men employed full time worked less hours per week in Finland and Luxembourg (each 38.4 hours) as well as Netherlands and Sweden (each 38.8 hours).
Source: Eurostat (lfsa_ewhan2)
The most significant difference between sexes, among the EU countries, was found in Ireland – with 40.5 for men and 36.5 for women, the Netherlands – with 38.8 weekly hours worked for men and 35.2 for women, Greece – with 42.5 for men and 39.3 for women, Italy – with 40.2 for men and 37.0 for women, Finland – with 38.4 for men and 35.7 for women, and Cyprus – with 41.3 for men and 38.8 for women.
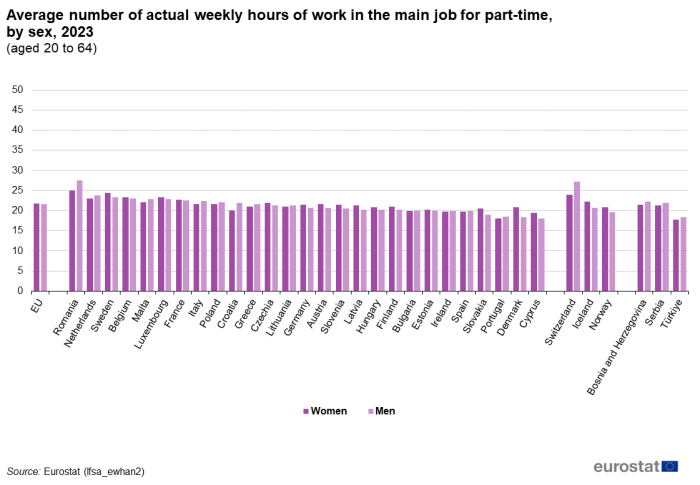
The pattern by sex was not the same for part-time workers (see Figure 4). At EU level, both men and women worked the same number of hours, approximately 22 hours per week. However, in many EU countries, part-time women workers recorded longer working weeks compared to men in the same category. Denmark stood out with the greatest difference in the number of actual weekly hours of work between women and men part-time workers (20.9 and 18.3 hours, respectively).
Source: Eurostat (lfsa_ewhan2)
How does the average actual working week vary across economic activities and occupations?
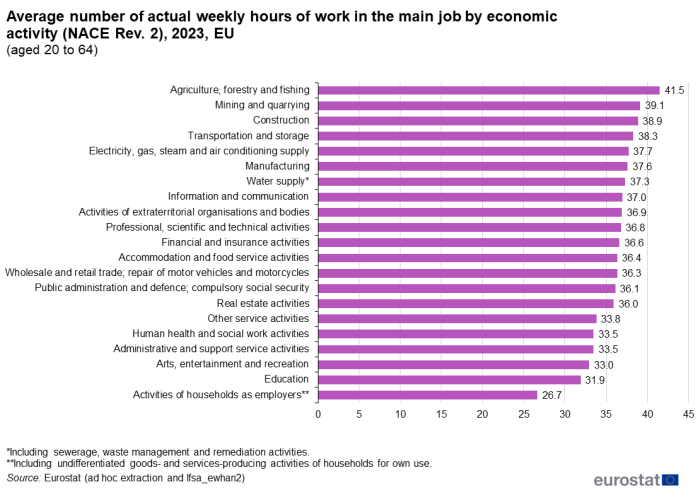
The length of the average working week measured in actual hours of work varies across different sectors of economic activities (NACE Rev. 2) (see Figure 5). In 2023, the economic activities recording the longest working week were agriculture, forestry and fishing (41.5 actual working hours), mining and quarrying (39.1) and construction (38.9), whilst activities of households as employers (26.7 actual working hours), education (31.9) and arts, entertainment and recreation (33.0) recorded the shortest working weeks.
Source: Eurostat (lfsa_ewhan2)
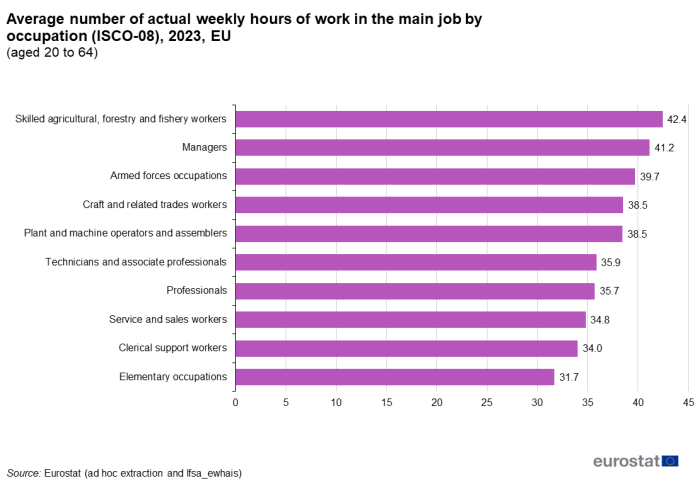
When looking at different groups of occupations (ISCO-08), skilled agricultural, forestry and fishery workers (42.4 actual working hours), managers (41.2) and armed forces occupations (39.7) had the longest average working weeks in the EU in 2023 (see Figure 6). By contrast, workers with elementary occupations (31.7 actual working hours), clerical support workers (34.0) and service and sales workers (34.8) had the shortest working weeks.
Source: Eurostat (lfsa_ewhais)
What are the differences between the usual average working week for employees and that for the self-employed?
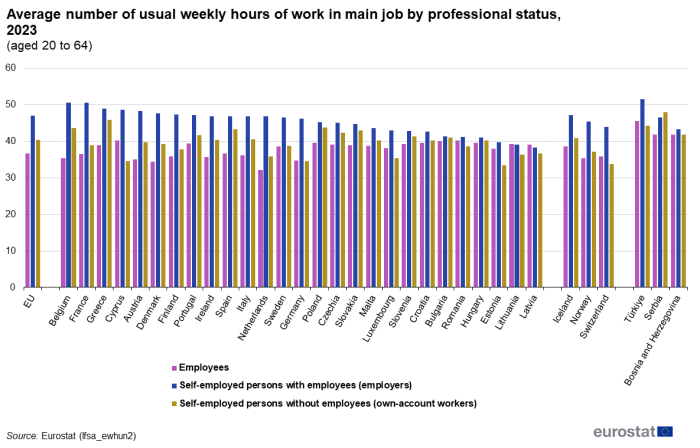
At EU level, in 2023, self-employed people with employees (i.e. employers) had the greatest number of usual weekly hours of work in their main job – 47.0 hours, followed by self-employed people without employees (also known as ‘own-account workers’) with 40.4, compared to employees with 36.6 hours per week (see Figure 7).
Countries with the longest average working week for employers were Belgium and France (both 50.6 usual hours of work per week). Moreover, Belgium shows the greatest difference in the number of usual hours of work per week, between employees (35.3) and own-account workers (43.6).
In many EU countries, own-account workers worked more hours per week than employees, in 2023. However, in Cyprus, Estonia, Germany, Latvia, Lithuania, Luxembourg and Romania employees worked significantly more than own-account workers – the greatest difference between the two professional statutes emerged in Cyprus and Estonia (employees worked on average 5.7 and 4.6 hours more than own-account workers, respectively, per week).
Amongst all EU countries, the longest working week for own-account workers was highlighted in Greece (45.8 usual hours of work per week), Poland (43.7), in Belgium (43.6), Spain (43.3) and Slovakia (43.0) Employees worked on average more hours per week in Cyprus and Romania (each 40.3), and Bulgaria (40.0). In all the other countries, the average working week counted less than 40 worked hours, for employees, in 2023. The Netherlands, Denmark and Germany show the shortest working week for employees (32.1, 34.4 and 34.7 usual hours of work per week, respectively).
Source: Eurostat (lfsa_ewhun2)
Source data for tables and graphs
Methods and definitions
Data sources
Data in this article are based on the European labour force survey (EU-LFS).
Source: The European Union Labour Force Survey (EU-LFS) is the largest European household sample survey providing quarterly and annual results on labour participation of people aged 15 years and over as well as on persons outside the labour force. It covers residents in private households. Conscripts in military or community service are not included in the results. The EU-LFS is based on the same target populations and uses the same definitions in all countries, which means that the results are comparable between the countries. The EU-LFS is an important source of information about the situation and trends in the national and EU labour markets. Each quarter around 1.2 million interviews are conducted throughout the participating countries to obtain statistical information for some 100 variables. Due to the diversity of information and the large sample size, the EU-LFS is also an important source for other European statistics like Education statistics or Regional statistics.
Reference period: Yearly results are obtained as averages of the four quarters in the year.
Most of the information collected during the survey relates to the respondent’s situation during a reference week (being generally the week, from Monday to Sunday, preceding the interview).
Coverage: The results from the EU-LFS currently cover all European Union Member States, the EFTA Member States Iceland, Norway and Switzerland, as well as the candidate countries Bosnia and Herzegovina, Serbia and Türkiye.
For Cyprus, the survey covers only the areas of Cyprus controlled by the Government of the Republic of Cyprus.
European aggregates: EU and EU-27 refer to the sum of the 27 EU Member States. If data are unavailable for a country, the calculation of the corresponding aggregates takes into account the data for the same country for the most recent available period. Such cases are indicated.
Definitions
The concepts and definitions used in the EU-LFS follow the resolutions of the International Conference of Labour Statisticians, hosted every five years by the International Labour Organisation (ILO).
Employment covers persons living in private households, who during the reference week performed work, for at least one hour, for pay, profit or family gain, or were not at work but had a job or business from which they were temporarily absent, for example because of illness, holidays, maternal or paternal leave or training.
Employment can be measured in terms of the number of persons, number of jobs, in full-time equivalents number of persons or in hours worked. All the estimates presented in this article use the number of persons; the information presented for employment rates is also built on estimates for the number of persons.
The LFS employment concept differs from national accounts domestic employment, as the latter sets no limit on age or type of household, and also includes the non-resident population contributing to GDP and excludes the resident population contributing to the GDP of another country and conscripts in military or community service.
Main concepts: Some main employment and working time characteristics, as defined by the EU-LFS, include:
- employees are defined as those who work for a public or private employer and who receive compensation in the form of wages, salaries, payment by results, or payment in kind; non-conscript members of the armed forces are also included;
- self-employed persons work in their own business, farm or professional practice. A self-employed person is considered to be working during the reference week if she/he meets one of the following criteria: works for the purpose of earning profit; spends time on the operation of a business; or is currently establishing a business. Self-employed persons with employees are called employers. Self-employed persons without employees are called own-account workers.
- the distinction between full-time and part-time work is generally based on a spontaneous response by the respondent. The main exceptions are the Netherlands and Iceland where a 35 hours threshold is applied, Sweden where a threshold is applied to the self-employed, and Norway where the thresholds are up to 32 hours for part-time, more than 36 hours for full-time, and the persons working between 32 and 36 hours are asked whether this is a full- or part-time position;
- actual hours worked in the reference week are the hours the person actually spends in work activities during the reference week. they provide measurement of direct labour input. Working hours are collected in time intervals based on a half-hour scale (i.e. 0-0.5 hour, 0,5-1 hour, 1-1.5 hour, etc..).
- usual hours worked are the number of hours per week usually worked in the main job. They are the modal value of the actual hours worked per week over a long reference period, excluding weeks when an absence from work occurs (e.g. holidays, leaves, strikes). They provide measurement of the organisation of working time. Working hours are collected in time intervals based on a half-hour scale (i.e. 0-0.5 hour, 0,5-1 hour, 1-1.5 hour, etc..).
Additional methodological information
More information on the EU-LFS can be found via the online publication EU Labour Force Survey, which includes eight articles on the technical and methodological aspects of the survey. The EU-LFS methodology in force from the 2021 data collection onwards is described in methodology from 2021 onwards. Detailed information on coding lists, explanatory notes and classifications used over time can be found under documentation.
For more information on the background definitions on hours of work, please consult Topic 6 “Working conditions including working
hours” from EU Labour Force Survey Explanatory Notes.
Context
Employment statistics can be used for a number of different analyses, including macroeconomic (looking at labour as a production factor), productivity or competitiveness studies. They can also be used to study a range of social and behavioural aspects related to an individual’s employment situation or employment as a source of household income.
Employment is both a structural indicator and a short-term indicator. As a structural indicator, it may shed light on the structure of labour markets and economic systems, as measured through the balance of labour supply and demand, or the quality of employment. As a short-term indicator, employment follows the business cycle; however, it has limits in this respect, as employment is often referred to as a lagging indicator.
Statistics on the hours of work adds a new dimension to employment. The “average number of usual weekly hours of work in the main job” is an indicator providing a perspective to the organisation of working time and social conditions on the labour market.

