Overall price levels
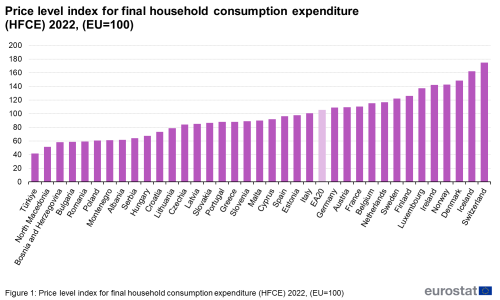
In 2022, price levels for consumer goods and services differed widely across Europe. The highest price level among EU Member States was observed in Denmark, 49 % above the EU average, while in Bulgaria and Romania the price level was 41 % below the EU average.
An understanding of the differences in price levels is important in the comparison of economic data, such as gross domestic product (GDP), because higher relative prices could make an economy look healthier than it really is. Observing price level differences is also important in the analysis of the development of the EU’s single market for goods and services.
Figure 1 shows the price level indices (PLIs) for total household final consumption expenditure (HFCE) on goods and services in 2022.
Price levels for food, beverages, tobacco, clothing and footwear
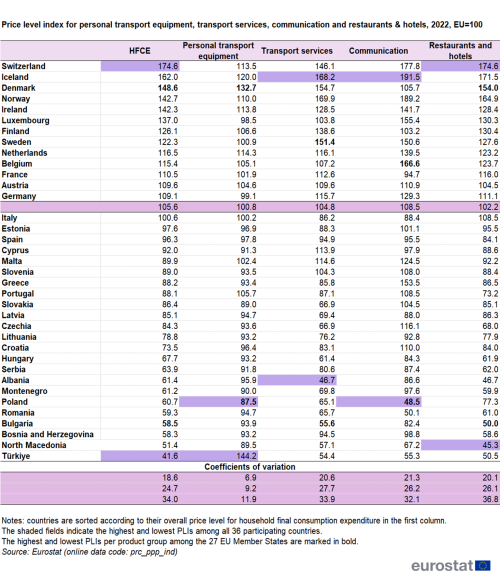
Table 1 shows the PLIs for four important groups of consumer goods and services (see below for a description of the content of each product group):
- food and non-alcoholic beverages;
- alcoholic beverages and tobacco;
- clothing;
- footwear.
These four groups represent on average 18 %, 5 %, 4 % and 1 % of household expenditure, respectively. For reference, the PLIs of total HFCE (those of Figure 1) are also shown. The shaded fields indicate the highest and lowest PLIs per product group among all 36 participating countries. The highest and lowest PLIs among the 27 EU Member States are marked in bold. At the bottom of the table, coefficients of variation are provided for the euro area (EA-20), the current composition of the EU (27 Member States) and the group of all 36 countries participating in the programme (All 36).
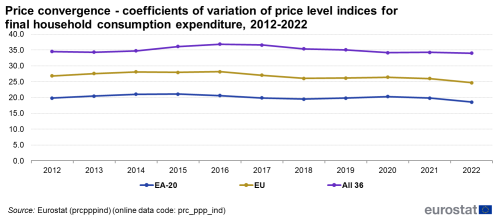
The coefficient of variation is defined as the standard deviation of the PLIs of the respective group of countries as a percentage of their average PLI. The higher the coefficient of variation for a given product group, the higher the price dispersion across countries.
Among the EU Member States, Denmark has the highest price level for food and non-alcoholic beverages, for clothing and for footwear, while Ireland is the most expensive for alcoholic beverages and tobacco. Among all countries, Switzerland has the highest price level for food and non-alcoholic beverages and for clothing, Norway for alcoholic beverages and tobacco and again Denmark for footwear.
North Macedonia shows the lowest price level of all 36 countries for alcoholic beverages and tobacco. Türkiye is the least expensive of the participating countries for food and non-alcoholic beverages, as well as for clothing and for footwear. Among the EU Member States, Romania is the least expensive country for food and non-alcoholic beverages and Bulgaria is the least expensive country for the other three categories (alcoholic beverages and tobacco, clothing, and footwear).
The highest price dispersion is found for alcoholic beverages and tobacco. This is mainly due to large differences in taxation on these products across the 36 countries. Less dispersion is observed in the prices of clothing and footwear.
Price dispersion is naturally greatest within the 36 country group, which includes both the high price EFTA countries and the (mostly) low price candidate countries.
Price levels for energy, furniture, household appliances and consumer electronics
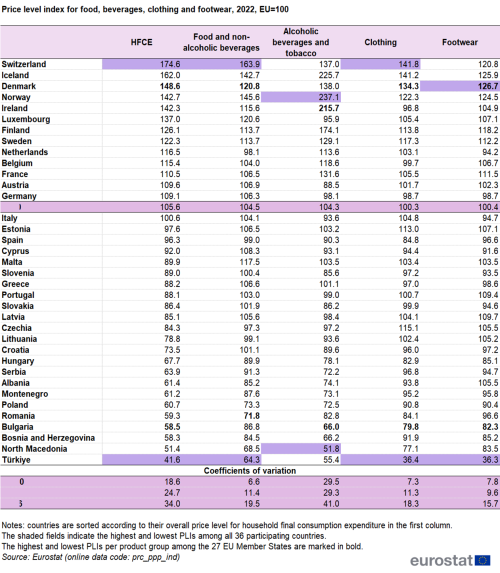
Table 2 shows the PLIs for another four groups of goods and services (see below for a description of the content of these groups):
- energy (electricity, gas and other fuels);
- furniture and furnishing, carpets and other floor coverings;
- household appliances;
- consumer electronics.
These groups represent on average 5 %, 2 %, 1 % and 1 % of household final consumption expenditure, respectively.
Price dispersion varies significantly between these four product groups, being most pronounced for electricity, gas and other fuels. Here, Denmark is the most expensive and Hungary the least expensive of all 36 participating countries.
For the other three groups shown in this table the price dispersion is much lower – especially for consumer electronics.
Among EU Member States, Luxembourg shows the highest price levels for furniture and furnishings and Bulgaria the lowest. For household appliances Malta is the most expensive country among EU Member States, while France has the highest PLI for consumer electronics. The lowest prices for these two groups are reported in Poland and Italy, respectively. Among all 36 countries, again Luxembourg is the most expensive for furniture and furnishings, while Iceland has the highest price levels for household appliances and for consumer electronics. At the other end, Türkiye is the least expensive for furniture and for consumer electronics.
Price levels for personal transport equipment, transport services, communication, restaurants and hotels
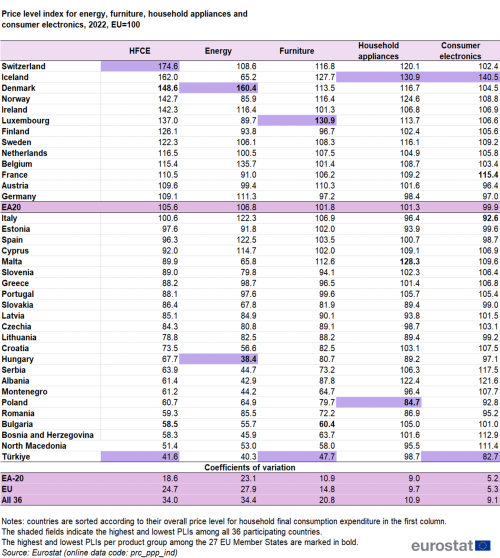
Table 3 shows the PLIs for another four groups of goods and services (see below for a description of the content of these groups):
- personal transport equipment;
- transport services;
- communication (services and equipment);
- restaurants and hotels.
These groups represent on average 2 %, 2 %, 3 % and 10 % of household final consumption expenditure, respectively.
Price dispersion for personal transport equipment is not very significant. Among EU Member States, Denmark stands out with a high PLI for this category. This is due to high taxation levels on cars. The lowest price level for this product group was found in Poland. Among all 36 countries, Türkiye shows the highest PLI for this group of goods.
Price dispersion is significantly higher among the other three service categories (transport services, communication as well as restaurants and hotels). In general, prices for services tend to show larger differences across countries than prices for goods, due to the higher share of labour input into services and the high dispersion of wages across countries.
Concerning transport services, Iceland shows the highest PLI among all countries, while Sweden reports the highest prices among EU Member States. The lowest price level among all countries is observed in Albania, while Bulgaria is the least expensive EU Member State in this category. Among all 36 countries the highest price level for communication can be found in Iceland and the lowest in Poland. Finally, Switzerland stands out with the most expensive restaurants and hotels, while the lowest prices for these services are observed in North Macedonia. Among the EU Member States, these positions are taken by Denmark and Bulgaria respectively.
Price convergence
Figure 2 shows the development over time of the coefficients of variation of the PLI for total household final consumption expenditure for three country groups. A decrease in the coefficients of variation is an indication of price convergence. Between 2012 and 2022 all country groups exhibit slight changes in this indicator.
Source: Eurostat (prc_ppp_conv)
Data sources
The full methodology used in the Eurostat–OECD Purchasing Power Parities (PPP) programme is described in the ‘Eurostat-OECD Methodological Manual on Purchasing Power Parities‘ available free of charge from the Eurostat website.
The PPP concept
In their simplest form PPPs are nothing more than price relatives that show the ratio of the prices in national currencies for the same good or service in different countries. For example, if the price of a hamburger in Sweden is 28.60 Swedish krona and in Italy it is 2.76 euro, the PPP for hamburgers between Sweden and Italy is 28.60 krona to 2.76 euro or 10.36 krona to the euro. In other words, for every euro spent on hamburgers in Italy, 10.36 krona would have to be spent in Sweden in order to obtain the same quantity and quality – or volume – of hamburgers.
Published PPPs, usually refer to product groups or broad aggregates like gross domestic product (GDP) rather than to individual products. However, these aggregate PPPs are based on sample surveys of individual goods and services.
Price level indices
The results of these surveys are expressed in the form of price level indices (PLIs). PLIs are the ratios of PPPs to exchange rates. They provide a comparison of countries’ price levels relative to the European Union average: If the price level index is higher than 100, the country concerned is relatively expensive compared to the EU average, while if the price level index is lower than 100, then the country is relatively inexpensive compared to the EU average. The EU average is calculated as the weighted average of the national PLIs, weighted with expenditures from national accounts.
Price level indices are not intended to rank countries strictly. In fact, they only provide an indication of the order of magnitude of the price level in one country in relation to others, particularly when countries are clustered around a very narrow range of outcomes. The degree of uncertainty associated with the basic price data and the methods used for compiling PPPs, may affect in such a case the minor differences between the PLIs and result in differences in ranking which are not statistically or economically significant.
Organisation
Within the framework of the Eurostat-OECD Purchasing Power Parities (PPP) programme, surveys on prices of household goods and services are carried out cyclically by the National Statistical Institutes (NSIs) of 36 countries. Each survey cycle comprises six surveys, each related to a particular group of household consumption products. As two surveys are carried out per year, the whole survey cycle takes three years to complete, before the next cycle starts.
The PLIs in this article are thus based on price data collected in 2020, 2021 and 2022. The prices collected in 2020 and 2021 have been updated to 2022 using detailed consumer price indices. The PLIs are based on annual national average prices for in total more than 2000 goods and services. The expenditure shares are based on national accounts data for 2022 and represent the average over all participating countries. The national accounts data are also used as weights in the aggregation of detailed PLIs to aggregate PLIs such as for household final consumption expenditure.
Definition of the product groups
The product groups discussed in this article can be broadly described as follows.
- Food and non-alcoholic beverages: bread and cereals; meat; fish; milk; cheese; eggs; oils and fats; fruits; vegetables; potatoes; other food; non-alcoholic beverages.
- Alcoholic beverages and tobacco: spirits; wine; beer; tobacco.
- Clothing: clothing materials; men’s, women’s, children’s and infant’s clothing; other articles of clothing and clothing accessories (excludes cleaning, repair and hire of clothing).
- Footwear: men’s, women’s, children’s and infants’ footwear (excludes repair and hire of footwear).
- Electricity, gas and other fuels: electricity; gas; liquid fuels; solid fuels; and heat energy (all for domestic use).
- Furniture and furnishing, carpets and other floor coverings: kitchen furniture; bedroom furniture; living-room and dining-room furniture; other furniture and furnishings; carpets and other floor coverings (excludes repair of furniture, furnishings and floor coverings).
- Household appliances: refrigerators and freezers; washing machines; dishwashers; cookers; microwave ovens; vacuum cleaners; coffee makers; kettles; toasters, etc. (excludes repair of household appliances).
- Consumer electronics: televisions; DVD players; receivers; audio systems; MP3 players; cameras; desktop and laptop computers; monitors; printers; scanners; software; music CDs; movie DVDs; empty CDs and DVDs etc (excludes repair of such equipment).
- Personal transport equipment: motor cars; motor cycles and bicycles (excludes maintenance and repair of personal transport equipment, spare parts and fuels).
- Transport services: Passenger transport by railway, by road, by air, by sea and inland waterway and other purchased transport services (e.g. left luggage services, removal services).
- Communication: postal services; telephone and telefax equipment; telephone and telefax services.
- Restaurants and hotels: restaurants; cafés; pubs; bars; canteens; hotels; youth hostels etc.
Context
Purchasing power parities (PPPs) are indicators of price level differences across countries. PPPs tell us how many currency units a given quantity of goods and services costs in different countries. PPPs can thus be used as currency conversion rates to convert expenditures expressed in national currencies into an artificial common currency, the purchasing power standard (PPS), eliminating the effect of price level differences across countries.
The main use of PPPs is to convert national accounts aggregates, like the gross domestic product (GDP) of different countries, into comparable volume aggregates. Applying nominal exchange rates in this process would overestimate the GDP of countries with high price levels relative to countries with low price levels. The use of PPPs ensures that the GDP of all countries is valued at a uniform price level and thus reflects only differences in the actual volume of the economy.
PPPs are also applied in analyses of relative price levels across countries. For this purpose, the PPPs are divided by the current nominal exchange rate to obtain a price level index (PLI) which expresses the price level of a given country relative to another, or relative to a group of countries like the EU.
The common rules for the provision of input data, and for the calculation and dissemination of PPPs, are laid down in Regulation (EC) No 1445/2007 of 11 December 2007.

