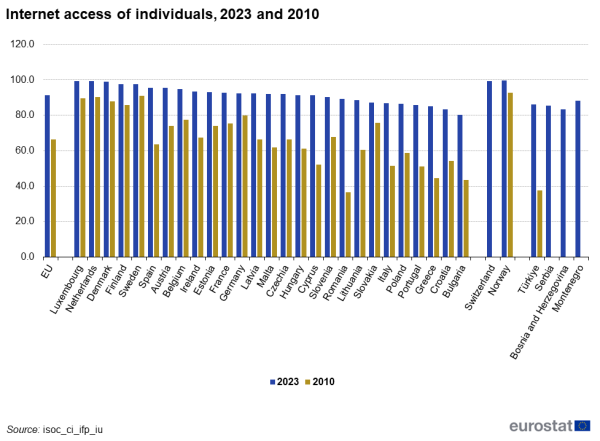
Internet access of individuals, 2010 and 2023
In Luxembourg, the Netherlands and Denmark, 99% of individuals surveyed used the internet for private purposes in 2023. The share of internet users was also particularly high in Finland and Sweden (98% both) and Spain (96%). Bulgaria (80%), Croatia (83%) and Greece (85%) reported the lowest rates of internet users in 2023.
The comparison with the 2010 figures shows that developments occurred in almost all countries in 13 years. The growth of the share of internet users from 2010 to 2023 in some member state is noticeable. Romania for example more than doubled the share of internet users reported in 2010 (36%) to reach 89% in 2023, an increase of 53 percentage points in 13 years. The increase in Greece was 41%, from 44% in 2010 to 85 % in 2023. In Bulgaria, the rise was 37%, from 43% in 2010 to 80 % in 2023. Sweden reported the lowest increase of 7% among the Member States from 91% in 2010 to 98% in 2023.
Source: Eurostat (isoc_ci_ifp_iu)
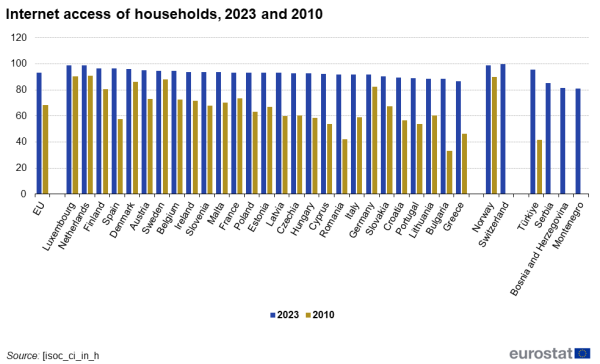
Internet access of households, 2010 and 2023
In 2023, the highest rates of household connection to the internet were reported by Luxembourg and by the Netherlands both with 99% (Figure 2). Household internet rates of internet connection were also high in Finland (97%), in Spain and Denmark (both at 96%). In 2023, the lowest rates of household internet access among the EU Member States were reported by Greece (87%), Bulgaria and Lithuania (both 89%).
Compared with 2010, few Member States reported a growth of only one digit in 13 years: Sweden (7%), the Netherlands (8%), Luxembourg and Germany (both 9%). The highest increase of the rate of households connected to internet were reported by Bulgaria from 33% in 2010 to 89%, a rise of 56 percentage points. In Romania, the increase was of 50 percentage points.
In Switzerland 100% of household had access to the internet in 2023, in Norway it was 99%.
Source: Eurostat (isoc_ci_in_h)
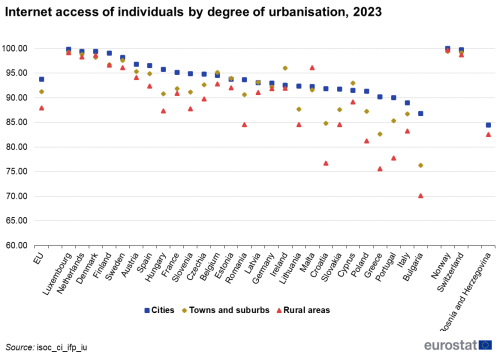
Figure 3 highlights the urban–rural divide within the EU in terms of internet access. In Luxembourg, the Netherlands and Denmark, the access to internet is similar for cities, towns and suburbs, and for rural areas in 2023. The difference in term of internet users between cities and rural areas was over 2 digits in Bulgaria (17%), Croatia (15%), Greece (15%) and Portugal (12%) in 2023.
Source: Eurostat (isoc_ci_ifp_iu)
Use of internet
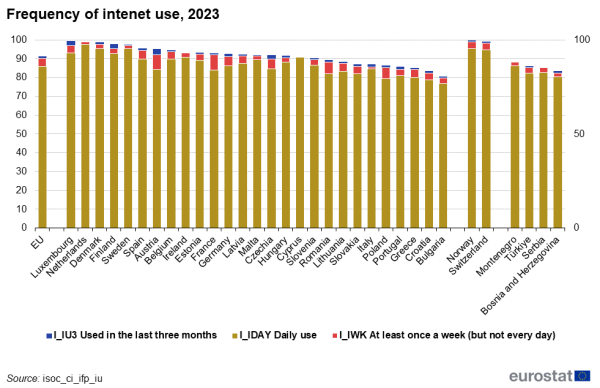
In 2023, 91% of the individuals between 16 and 74 years used the internet at least once within the three months prior to the survey date. Those who reported not having used the internet were 6% in 2023. With 99% three Member States (Luxembourg, Denmark and Sweden) were close to full coverage of internet users in 2023. The lowest proportion of internet users were reported by Bulgaria (80%), Croatia (83%) and Greece (85%). The proportion of individuals not having used the internet exceeded double digits in Croatia (14%), Greece (13%), Portugal and Bulgaria (both 12%).
In 2023, Norway and Switzerland reported the share of internet users of 100% and 99% respectively. The share of individuals who had never used the internet was over double digits in Bosnia and Herzegovina (14%) and in Türkiye (13%) in 2023.
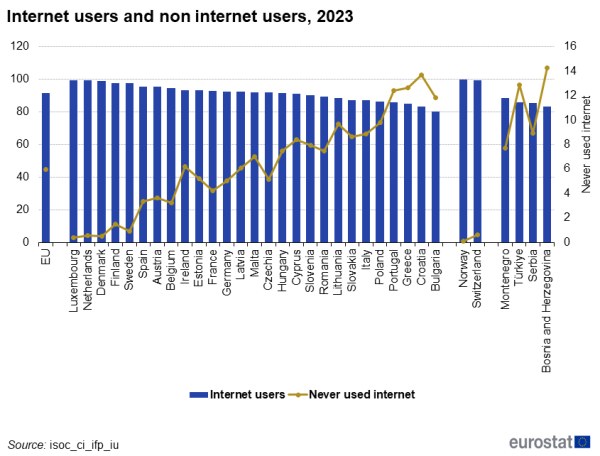
(% of individuals aged 16 to 74)
Source: Eurostat (isoc_ci_ifp_iu)
Figure 5 highlights the frequency of the use of internet in the EU in 2023. 86% of the individuals between 16 and 74 years had a daily use of the internet in 2023, 4% used it at least once a week (but not every day).
Devices used to connect to the internet
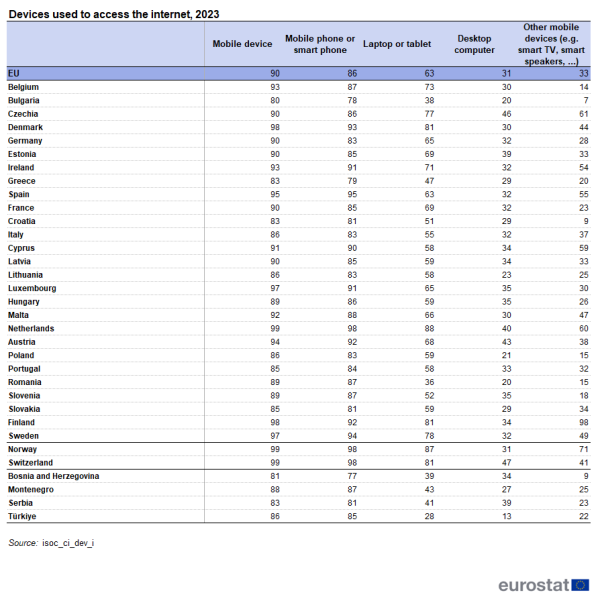
Table 1 looks at the type of devices used to connect to the internet in 2023. Mobile devices were used to connect to the internet by 9 out of 10 EU internet users in 2023. The connection through a laptop or a tablet was opted for by 63% while 31% of EU internet users connected via a desktop computer in 2023.
Over 9 individuals out of 10 used a mobile or a smart phone to connect to the internet in the Netherlands (98%), Spain (95%), Sweden (94%), Denmark (93%), Austria (92%), Luxembourg and Ireland (both 91%), Cyprus (90%). The Netherlands also reported the highest proportion of connection to the internet through laptop and tablet (88%), while Czechia presented the highest rate of connection via the desktop computer with 46%.
Source: Eurostat (isoc_ci_dev_i)
Purpose of the use of internet
The internet is basically a means of communication. Internet is used to communicate in all areas of everyday life. ICT surveys collect data on the mediation of the internet for a very large number of purposes such as communication, access to the information, use of entertainment, etc. In this publication, the focus has been arbitrarily restricted on 3 purposes: telephoning, video calls or instant messaging, learning online activities and civic and political participation.
EU internet users were 82% to use internet for telephoning, video calls or instant messaging in 2023. In the Netherlands, the share reached 98%, 94% in Spain and Denmark. Slovenia (73%) and Poland (72%) reported the lowest rate of internet users for telephoning, video calls or instant messaging.

Source: Eurostat (isoc_ci_ac_i)
The internet can be a powerful tool for learning in the context of pursuing education or work but also for private purposes. In 2023, there were 31% in the EU to use internet for learning either in the context of pursuing education or even for private purposes. The Netherlands (57%) and Finland (55%) reported in 2023 the highest proportion among the Member States of internet users for learning purposes. At the other end of the range, the lowest share was recorded in Romania (11%), followed by Bulgaria (15%) and Greece (16%).
In 2023, only 18% of EU internet users expressed their opinions on civic or political issues on websites or social media. The share of persons having expressed their civic or political opinions via internet grew to 34% in Malta, to 30% in Hungary and Estonia in 2023. In Cyprus, this share dropped to 10%, the lowest among the Member States in 2023.
Use of e-government
Interaction with public authorities:
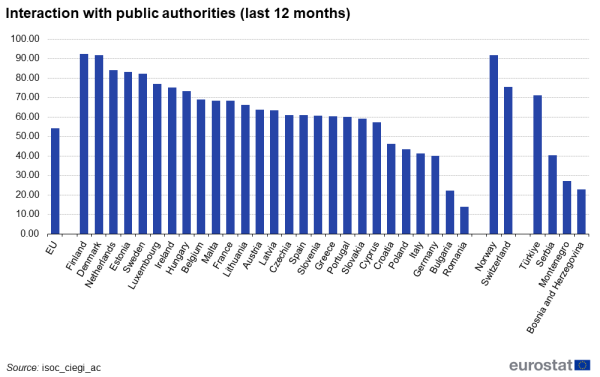
In 2023, 54% of EU internet users interacted with public authorities. Some for obtaining information such as on pension rights, office opening hours, health, etc. In Finland and Denmark the share of internet users having interacted with public authorities was the highest among the Member States with 92%. In the Netherlands, the share was 84%. The lowest rate of internet users having interacted with public authorities was in Romania with 14%.
Source: Eurostat (isoc_ciegi_ac)
Request of official documents:
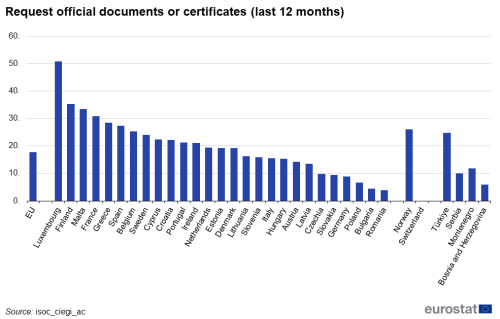
A large number of official documents or certificates can be requested online from public authorities’ websites. In 2023, 18% of internet users requested official documents or certificates from public authorities. Luxembourg reported the highest rate among the Member States with 51% of the internet users having requested official documents or certificates in 2023. Finland and Malta followed with 35% and 33% respectively. In some Member States, the share was below two digits: Romania and Bulgaria (both 4%), Poland (7%), and Germany and Slovakia (both 9%).
Source: Eurostat (isoc_ciegi_ac)
Ordering or buying goods and services
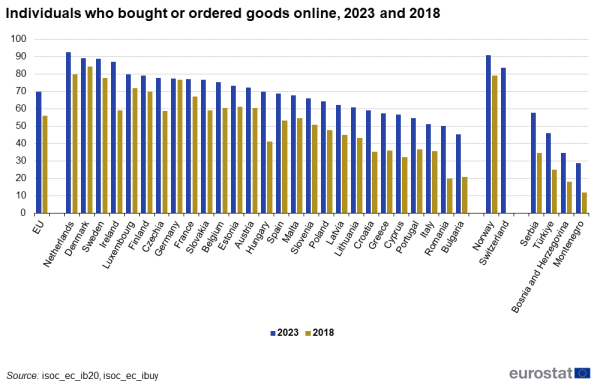
In 2023, 70% of individuals aged 16 to 74 in the EU ordered or bought goods or services over the internet for private use, up from 56% in 2018 (see Figure 8). The Netherlands (92%), Denmark and Sweden (89% both) presented the highest share of internet users having bought goods or services online. Over 3 internet users out of 4 also bought or ordered goods online in the following countries: Ireland, Luxembourg, Finland, Czechia, Germany, France and Slovakia.
Romania (50 %) and Bulgaria (45 %) reported the lowest rates of internet users having bought or ordered goods online in 2023.
The largest increase in the proportion of individuals who ordered or bought goods or services over the internet between 2018 and 2023 were observed in Romania (up by 30 percentage points), Hungary (up 29 percentage points), and in Ireland (up by 28 percentage points).
Source: Eurostat (isoc_ec_ib20)
Source data for tables and figures (MS Excel)
Data sources
Rapid technological change in areas related to the internet and other new applications of ICTs pose challenges for statistics. As such, there has been a considerable degree of development in this area, with statistical tools being adapted to satisfy new demands for data. Indeed, statistics within this domain are reassessed on an annual basis in order to meet user needs and reflect the rapid pace of change.
This approach is replicated in Eurostat’s survey on ICT usage in households and by individuals. This annual survey is used to benchmark ICT-driven developments, both by following developments for core variables over time and by looking in greater depth at other aspects at a specific point in time. While the survey initially concentrated on access and connectivity issues, its scope has subsequently been extended to cover a variety of subjects (for example, e-government and e-commerce) and socioeconomic analysis (such as regional diversity, gender specificity, differences in age, education and the employment situation). The scope of the survey with respect to different technologies is also adapted so as to cover new product groups and means of delivering communication technologies to end-users (such as introducing new questions about online peer-to-peer accommodation or transport services in 2017).
The reference period for the survey on ICT usage in households and by individuals is in most cases the first quarter of each year; in most countries, the survey is conducted in the second quarter of each year.
Coverage and definitions
The household ICT survey covers those households having at least one member in the age group 16 to 74 years old. Internet access of households refers to the percentage of households that have an internet access, so that anyone in the household could use the internet at home, if so desired, even simply to send an e-mail.
Internet users are defined as all individuals aged 16 to 74 who had used the internet in the three months prior to the survey. Regular internet users are individuals who used the internet, on average, at least once a week in the three months prior to the survey.
The wired technologies most commonly used to access the internet are divided between broadband and dial-up access over a normal or an ISDN telephone line. Broadband includes digital subscriber lines (DSL) and uses technology that transports data at high speeds. Broadband lines are defined as having a capacity higher than ISDN, meaning equal to or higher than 144 kbit/s. Popular devices to access the internet at home include desktop and portable computers, while more recently there has been an expansion in other internet-enabled technologies.
Mobile internet usage is defined as using the internet away from home or work on portable computers or handheld devices via mobile phone networks or wireless connections.
The ordering of goods and services by individuals refers to the 3-month period prior to the survey and includes rented accommodation or transport services, purchasing financial investments, telecommunication services, video games or software, as well as information services from the internet that are directly paid for. Goods and services that are obtained via the internet for free are excluded. Orders made by manually typed e-mails, SMS or MMS are also excluded.
Context
In 2019, the new European Commission President, Ursula von der Leyen, described how she wanted the EU to grasp the opportunities presented by the digital age. Such a digital transformation is based on the premise that digital technologies and solutions should: open up new opportunities for businesses; boost the development of trustworthy technology; foster an open and democratic society; enable a vibrant and sustainable economy; help fight climate change.
Data from this survey supports measuring the implementation of one of the six priorities for the period 2019-2024 of the von der Leyen European Commission – A Europe fit for the digital age.
The strategy is built on three pillars: (1) Technology that works for the people; (2) A fair and competitive digital economy; (3) An open, democratic and sustainable society.
Furthermore, it facilitates the monitoring of the EU’s digital targets for 2030, set by the Digital Compass for the EU’s Digital Decade, evolving around four cardinal points: skills, digital transformation of businesses, secure and sustainable digital infrastructures, and digitalization of public services. On 15 September 2021, the Commission proposed the Path to the digital decade, which introduces a governance framework to reach the targets set out by the 2030 Digital Compass.
Data on the use of ICT in households and by individuals appears among the monitoring indicators of the European Skills Agenda.
Other links:

