Professionals and technicians employed in science and technology occupations
In 2022, almost 76 million people in the EU aged from 15 to 74 were employed in science and technology (and therefore considered as human resources in science and technology by occupation, an increase of 2.5 % compared with 2021.
Within this 76 million, 69.8 million people were in the 25 to 64 age group, an increase of 2 % compared with 2021.
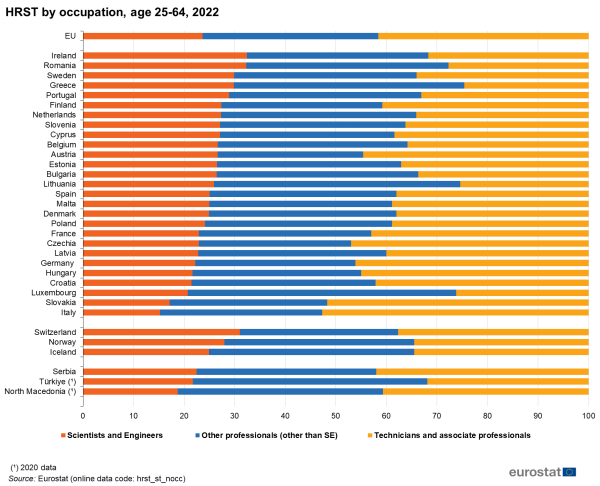
From this broad group 58.4 % were ‘professionals’. However, the percentage differed greatly between Member States. Greece (75.4 %), Lithuania (74.6 %) and Luxembourg (73.8 %) reported the highest proportion of professionals. Other Member States with more than two thirds professionals were Romania (72.3 %), Ireland (68.3 %) and Portugal (66.9 %). (see Figure 1).
Source: Eurostat (hrst_st_nocc)
The ‘professionals’ subgroup includes a special category of interest, ‘scientists and engineers’, covering people employed in science and engineering, health and information and communications technology. In 2022, scientists and engineers made up 23.7 % of people employed in S&T occupations in the EU. In absolute terms, the number of scientists and engineers increased by 3.2 % in the EU compared with 2021 and the country with the largest number of scientists and engineers was Germany, with over 3.5 million scientists and engineers.
The professional subgroup contains also 34.7% of ‘Other professionals (other than scientists and engineers)’) and 41.6 % were ‘technicians’.
Regional characteristics of people in science and technology occupations
The stock of persons employed in science and technology occupations (HRST by occupation) can be used as an indicator of the development of the knowledge-based economy and is the key to the development of knowledge and technological innovation in all regions of the European Union.
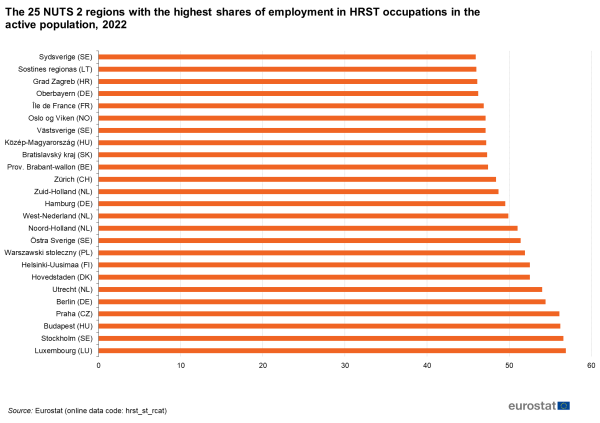
The employment in science and technology occupations tends to be concentrated in capital cities and the surrounding regions, in regions with key universities and research institutions and in regions where large businesses have set up their headquarters and main research units. In 2022, fourteen of the 25 NUTS 2 regions with the highest share of persons employed in science and technology in their labour force in the EU, EFTA and Candidate countries were capital cities (see Figure 2).
The Nordic capital regions were among the top regions. The top list also included a number of regions with key universities and research centres, such as the Brabant-Wallon region in Belgium, Hamburg in Germany and Utrecht in the Netherlands.
Source: Eurostat (hrst_st_rcat)
Senior human resources in science and technology
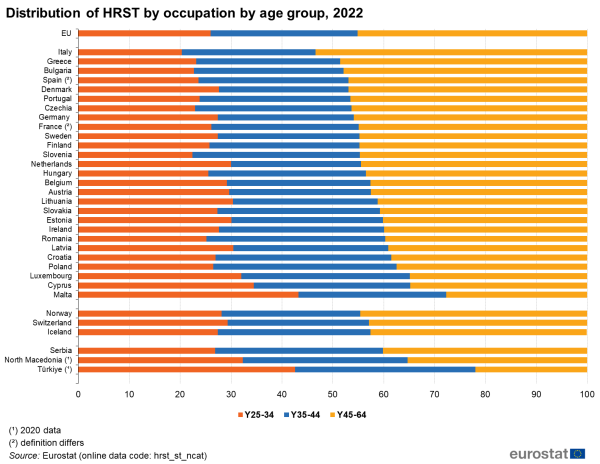
In 2022, from the 69.8 million people employed in science and technology in the EU, more than 31.5 million were ‘senior’ HRST by occupation, i.e. between 45 and 64 years old. This corresponds to 45.1 % of persons employed in S&T occupations in the EU. Making a comparison, the 18.1 million people aged 25-34 in the HRST by occupation in 2022 corresponded to 26 % of persons employed in S&T occupations in the EU.
Among the Member States, Italy has the largest share of senior HRST by occupation with 53.4 %. Greece, Bulgaria, Spain, Denmark, Portugal, Czechia and Germany also have more than 45 % of senior HRST by occupation (see Figure 3). At the other end of the scale, Malta (27.7 %) has the smallest share of senior persons employed in S&T occupations.
Source: Eurostat (hrst_st_ncat)
Women in science and technology
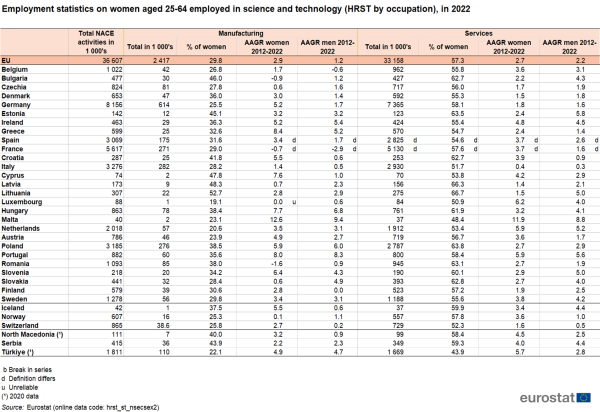
In 2022, 33.2 million women were working in service activities, compared to only 2.4 million in manufacturing activities in the EU. The women that were employed in science and technology worked predominantly in service activities. Malta was an exception with 48.4 % of women working in services (see Table 1).
Source: Eurostat (hrst_st_nsecsex2)
The situation was different in manufacturing, where at EU level, women accounted for only 29.8 % of persons employed in S&T occupations. In 2022, only Lithuania reported that more than 50 % of HRST by occupation employed in manufacturing were women.
Between 2012 and 2022, the average annual growth rate (AAGR) in the EU for HRST by occupation for women employed in the services sector was higher than for men, increasing by 2.7 % a year compared to 2.2 % for men. The same happened for HRST women employed in manufacturing sector, where numbers grew by 2.9 % a year compared to 1.2 % for men.
Analysing the employment of the 15-74 age population in science and technology occupations by NUTS 1 regions shows that the highest shares of women employed in science and technology occupations in 2022, with more than 60 %, can be observed in Lietuva (64.1 %), Corse (63.9 %), Latvija (62.7 %), Makroregion Centralny (61.1 %), Régions ultrapériphériques françaises (60.7 %), Alföld és Észak in Hungary (60.6 %) and Região Autónoma da Madeira in Portugal (60.4 %) followed by Eesti (59.6 %) and Severna i yugoiztochna Bulgaria (59.8 %). The top 25 regions in the EU, EFTA and Candidate countries are ranked in Figure 4.
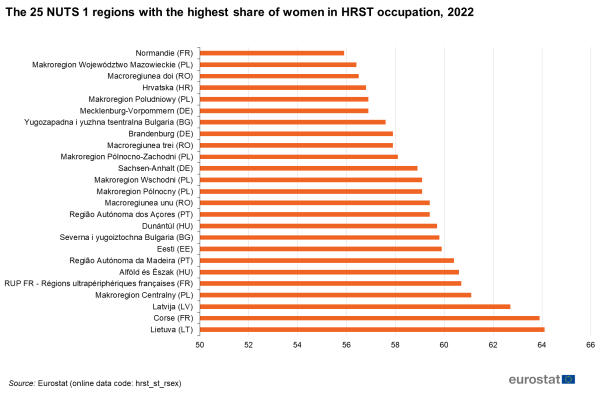
Source: Eurostat (hrst_st_rsex)
Source data for tables and graphs
![]() Human Resources in Science and Technology – Stocks: table and figures
Human Resources in Science and Technology – Stocks: table and figures
Data sources
The data on the workforce in science and technology are obtained from the EU Labour Force Survey. Particular attention is paid to scientists and engineers, who are often the innovators at the centre of technology-led development.
The data on the workforce in science and technology cover employment status, occupation and education. Statistics are broken down by gender, age, region, sector of economic activity, occupation, educational level, fields of education, nationality and country of birth. Not all data combinations are possible.
Context
Innovation Union
The Innovation Union initiative seeks to improve both the framework for research and innovation in the EU and access to finance. The aim is to ensure that innovative ideas can be turned into products and services that create growth and jobs.
A key element of the Innovation Union involves completion of the European Research Area (ERA), aiming to increase the competitiveness of European research institutions by bringing them together and encouraging a more inclusive way of work. Increased mobility of knowledge workers and deeper cooperation among EU research institutions are central ERA goals.
The ERA should inspire the best talents to enter research careers in Europe and encourage industry to invest more in European research. It will enable European researchers to develop strong links with partners around the world, so that Europe benefits from the advancement of knowledge worldwide, contributes to global development and takes a leading role in international initiatives to solve issues that affect us all.

