Number of ICT specialists
In 2023, almost 10 million persons worked as ICT specialists across the European Union (EU). The highest number (2.1 million) worked in Germany, which provided work to more than one-fifth (21.5 %) of the EU’s overall employed population working as ICT specialists. France (1.3 million) had the second largest share of ICT specialists in employment (13.8 % of the EU total), followed by Italy and Spain (respectively almost one million (9.9 %) and 0.9 million representing 9.6 % of the EU total).
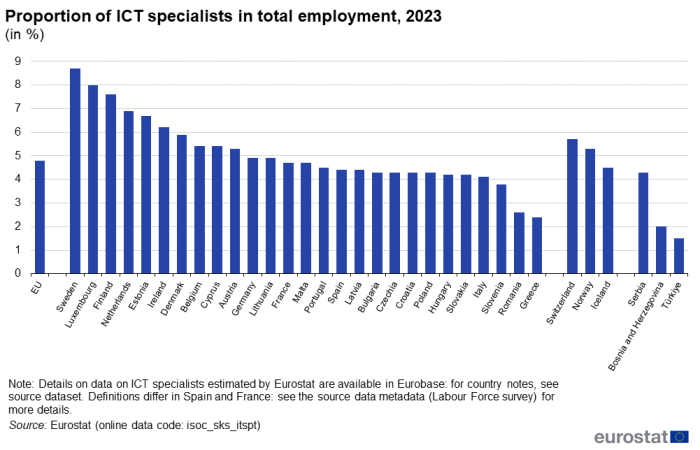
Across the whole of the EU, ICT specialists accounted for 4.8 % of the overall employed persons in 2023 (see Figure 1).
(in %)
Source: Eurostat (isoc_sks_itspt)
Sweden had the highest relative share of its total employed population working as ICT specialists, with 457 900 persons employed as ICT specialists, representing 8.7 % of total employment in Sweden, followed by Luxembourg and Finland where respectively about 25 800 and 200 700 ICT specialists represented 8.0 % and 7.6 % of total employment. Relatively high shares of persons employed as ICT specialists were also recorded in the Netherlands, Estonia, Ireland, Denmark, Belgium, Cyprus and Austria in 2023, with each reporting that more than 1 in 20 persons within their total employed population working as an ICT specialist. By contrast, at the other end of the range, ICT specialists accounted for 2.4 % of total employment in Greece and 2.6 % in Romania.
In EFTA countries, ICT specialists were relatively more numerous in Switzerland followed by Norway with relative shares of total employment higher than the EU average (respectively 5.7 % and 5.3 %). In Iceland, 4.5 % of the overall employed persons were employed as ICT specialists. Among candidate countries presenting data for 2023, the highest share of ICT specialists in total employment was 4.3 % in Serbia, below the EU average.
General developments in the demand for ICT specialists
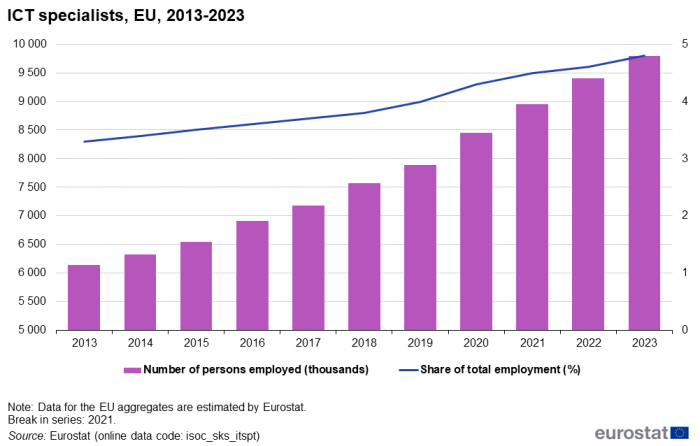
During the last decade, the number of persons employed as ICT specialists in the EU generally held out against the effects of the global financial and economic crisis and the downturn experienced in many labour markets. As a consequence, the share of ICT specialists in total employment increased by 1.5 percentage points (pp) from 3.3 % in 2013 to 4.8 % in 2023 (Figure 2).
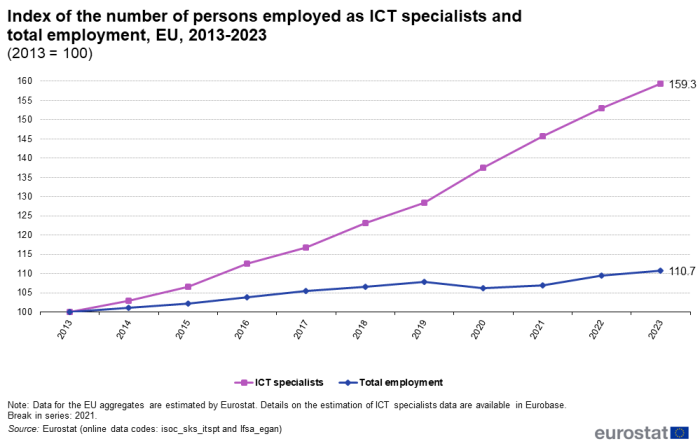
The number of persons employed as ICT specialists increased by 59.3 % during the period from 2013 to 2023, which was slightly less than 5 times as high as the corresponding increase (10.7 %) for total employment (see Figure 3).
Over the decade, ICT specialists in employment rose with an average annual growth rate of 3.8 %. After a monotonously increasing path between 2013 and 2019, the number of persons employed as ICT specialists presented higher progression rates between 2019 and 2021 with 7.1 % and 6.0 %. In the last years of the decade, the progression slightly decelerated but still revealed a higher rate than those prevailing in the beginning of the decade with 5.0 % between 2021 and 2022 and 4.1 % between 2022 and 2023. This overall growing tendency could reflect the digital transformation affecting the whole economy (Figure 3).
(2013 = 100)
Source: Eurostat (isoc_sks_itspt) and (lfsa_egan)
Human capital in ICT is a driving force for digital and digital-enabled innovations and may be considered crucial for the competitiveness of modern-day economies. Although this segment of the labour market is quite small in absolute terms, ICT employment was relatively resistant to the cyclical nature of economic events during the most recent decade for which data are available. Indeed, as can be observed in Figure 3, annual rates of change for the number of persons employed as ICT specialists were consistently higher than those recorded for total employment across the EU economy.
In the first two years of the decade, the rates of change for the number of persons employed as ICT specialists in the EU and for total employment showed slightly different patterns. Whilst the number of ICT specialists in employment increased with an annual average rate of 4.8 %, total employment increased by 1.0 % each year on average. The global financial and economic crisis and its aftermath did not seem to affect the number of ICT specialists employed in the EU. The transition between 2019 and 2020 led to the highest annual progression of the index of the number of persons employed as ICT specialists ever observed during the decade, with a jump of 9.2 points of index. The tendency then reversed in the following years. Between 2022 and 2023, ICT specialists still progressed in the total work force but at a slower pace of 6.3 points largely above the 1.1 points increase of total employment.
ICT specialists by sex
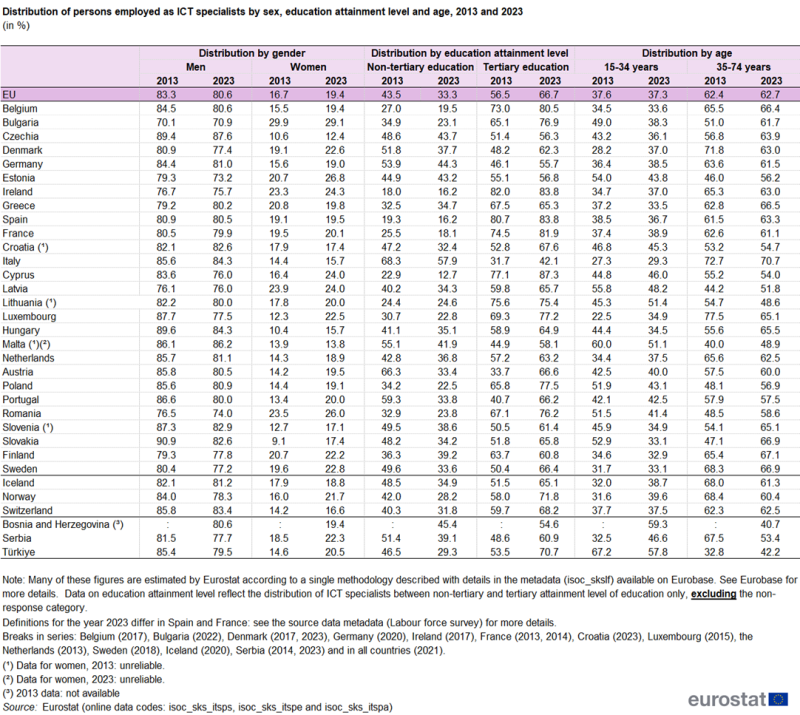
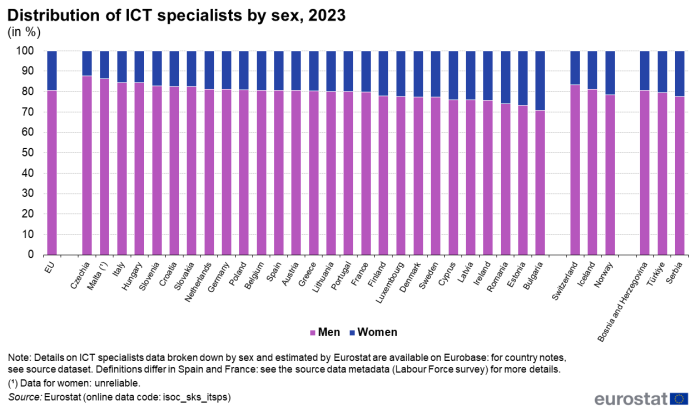
The vast majority of persons employed as ICT specialists in the EU are men. The share of ICT employment that was accounted for by men stood at 80.6 % in 2023, which was 2.7 pp lower than it had been in 2013 (see Figure 4 and Table 1). In 2023, less than 9 out of 10 ICT specialists in Czechia (87.6 %), Malta (86.2 %) followed by Italy and Hungary (both with 84.3 %) were men. While men accounted for about 8 out of every 10 ICT specialists in the majority of the remaining EU Member States, Romania (74.0 %), Estonia (73.2 %) and Bulgaria (70.9 %) were the only Member States where the share of men was lower than 75 %.
Indeed, in Bulgaria, women accounted for 29.1 % of ICT specialists in 2023 — the highest share among the EU Member States. Women accounting for about one-quarter of all ICT specialists were also found Estonia and in Romania and for one-fifth or more of all ICT specialists in ten other EU countries (Figure 4).
In absolute terms, there were more than a third of a million female ICT specialists employed in Germany (399 600) in 2023. These were, by far, the highest levels of female employment expressed in thousands, as France (271 500), Spain (183 000), Italy (152 300), Poland (142 100), the Netherlands (127 100) and Sweden (104 300) were the only other Member States to record 100 000 and more women employed as ICT specialists.
A closer analysis of this gender gap reveals that there were 23 EU Member States where the share of female ICT specialists rose during the period 2013 – 2023. The most striking progressions were observed in Luxembourg where the share of women in the total number of ICT specialists rose from 12.3 % to 25.5 % (up 10.2 pp), followed by Slovakia and Cyprus, up 8.3 pp and 7.6 pp respectively. By contrast, the relative share of men in the total number of ICT specialists rose the most in Greece, Bulgaria, Croatia and Malta, up by 1.0 pp, 0.8 pp, 0.5 pp and 0.1 pp respectively.
In the three EFTA countries for which data are available, the gender distribution of ICT specialists in employment in 2023 was relatively similar to that in the EU, as the male shares of ICT specialists ranged from 83.4 % in Switzerland to 78.3 % in Iceland.
In Türkiye, one of the few non-EU country with available data, the gender gap had narrowed between 2013 and 2023 by 5.9 pp with men accounting for 79.5 % of all ICT specialists compared with 20.5 % for women, above the EU average.
(in %)
Source: Eurostat (isoc_sks_itsps)
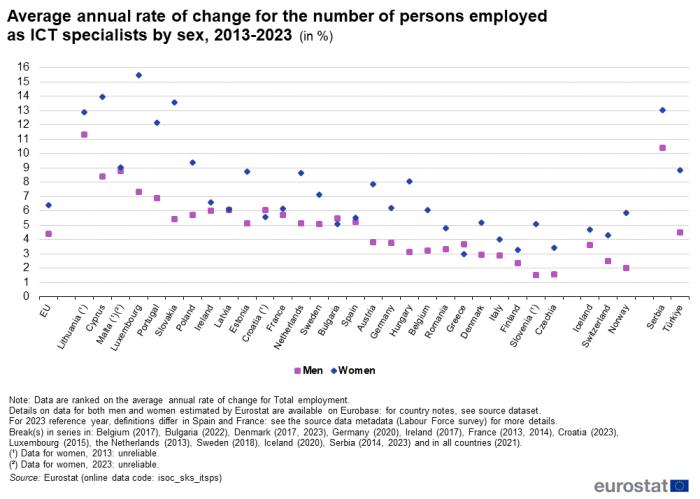
Figure 5 shows average annual rates of change for employment among ICT specialists, with data for men and women separately. On average, the number of men employed as ICT specialists in the EU rose by 4.4 % per annum during the period 2013 to 2023, while the corresponding rate for women was 6.4 % per annum. As a result, the overall number of male ICT specialists increased by 53.9 %, while the overall increase in the number of female ICT specialists was 85.6 %.
In all of the EU Member States, both numbers of men and women employed as ICT specialists recorded steady annual growth between 2013 and 2023. At individual country level, Lithuania had taken the lead with an overall average annual progression rate of 11.6 % followed by Cyprus (with 9.6 %) and Malta with 8.8 % per annum thanks to their leading position for employing female ICT specialists at an average annual growth rate of 13.9 % and 9.0 % respectively. In Lithuania, however, the gender gap was more balanced over the decade with overall average progression rates for men of 11.3 % and for women of 12.9 %.
Between 2013 and 2023, the employment of female ICT specialists progressed on average at a higher pace in Luxembourg (with 15.5 %) and in Cyprus (with 13.9 %), followed by Slovakia (13.6 %), Lithuania (12.9 %) and Portugal (12.1 %). Slovakia, Luxembourg, Cyprus, Portugal and Hungary were the countries where the difference between annual average growth rates of women and men were the highest.
Rather high rates of average annual growth of ICT specialists in employment were also observed in Serbia with an overall rate of 10.9 %, 10.4 % for men and 10.9 % for women (over the period 2013-2023).
ICT specialists by attainment level of education
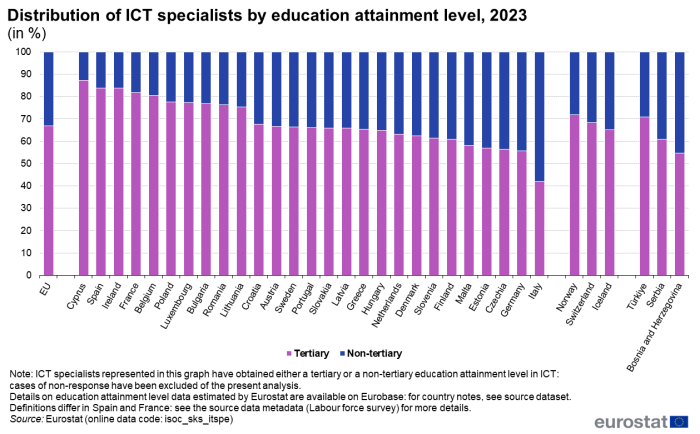
In 2023, two-thirds (66.7 % of those who reported their education attainment level) of all ICT specialists in the EU had completed a tertiary level of educational attainment (see Figure 6 and Table 1).
Data on ICT specialists by attainment level of education presented in Table 1 and in Figure 6 have been recalculated to retain only the categories of tertiary and non-tertiary education attainment levels. Reported cases of non-response are published in details on Eurobase.
The share of ICT specialists with a tertiary level of educational attainment increased during the most recent decade for which data are available, rising from 56.5 % in 2013 to 66.7 % in 2023; in other words, the share of ICT specialists that had a high level of educational attainment rose by 10.2 pp in the decade 2013-2023.
In the period covering 2013 to 2023, the analysis reveals that the share of ICT specialists with a tertiary level of educational attainment rose by more than 30 pp in Austria, more than 25 pp in Portugal, 15 pp in Sweden, and more than 10 pp in other nine countries: Croatia, Denmark, Slovakia, Malta, Bulgaria, Poland, Slovenia, Italy and Cyprus. All those countries observed two-digit progression in percentage points (pp). Twelve remaining EU Member States reported that their share of ICT specialists with a tertiary level of educational attainment increased during this period. Three countries however, (Lithuania, Greece and Finland) experienced a reversed tendency with an increase of persons who have not attained a tertiary level of education but who were employed as ICT specialists (with respectively -0.2 pp, -2.2 pp and -2.9 pp) (Table 1). Large educational attainment gaps (above 10 pp) over the decade were also observed in Iceland, Norway, Türkiye and Serbia.
(in %)
Source: Eurostat (isoc_sks_itspe)
Among the EU Member States, the highest shares of ICT specialists with a tertiary level of educational attainment were recorded in Cyprus, Spain, Ireland, France and Belgium as more than four out of every five persons had obtained such a level of education in 2023. A majority of ICT specialists had attained a tertiary level of education in all but one of the remaining EU Member States, the exception being Italy (42.1 %).
In all of the EFTA countries providing data, shares of ICT specialists in possession of a tertiary level of education were close to the European average, with 71.8 % in Norway, followed by Switzerland with 68.2 % and 65.1 % in Iceland with the lowest share (Figure 6).
Türkiye was the only candidate country, among the countries where data was available, to display a higher proportion of ICT specialists having attained a tertiary level of education higher than the EU average with a share of 70.7 %.
ICT specialists by age group
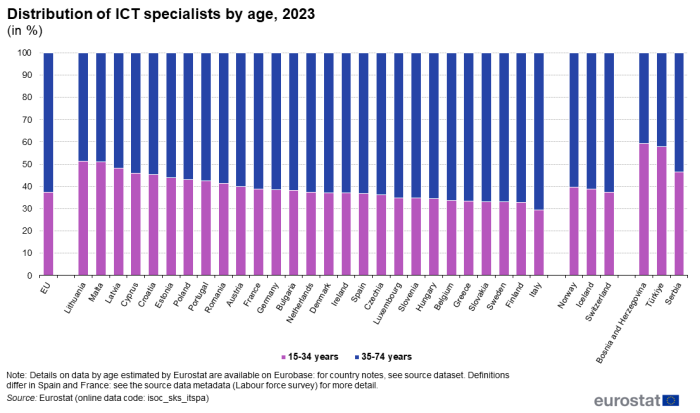
The age distribution of ICT specialists is presented using two age groups: persons aged 15-34 years and those aged 35 years and over, with an upper age for employment limited at 74 years (see Figure 7 and Table 1).
In 2023, less than two-thirds (62.7 %) of all persons employed as ICT specialists in the EU were aged 35 years and over. The proportion of ICT specialists in this older age group increased by 0.3 pp over the decade 2013-2023. This rising share may reflect, among others, changes in the age structure of the EU population (with relatively few young compared with middle and older-aged people) and/or a growing share of young people extending their stay within the education system rather than quickly entering the labour market. This statement is illustrated by Slovakia which experienced the highest progression of the 35 years old and over ICT specialists with 19.8 pp difference between 2013 and 2023.
Other four countries showed an increase of the older age group with a double-digit difference: Slovenia, Bulgaria, Estonia and Romania. Observing a completely different pattern, Luxembourg leading Denmark and Lithuania observed a rejuvenation of ICT specialists with an increase of respectively 12.48 pp, 8.8 pp and 6.1 pp of the younger age group. Other 8 countries (Portugal, Cyprus, Sweden, France, Italy, Germany, Ireland and Netherlands) followed this pattern but with lesser differences.
In 2023, the EU Member States where people aged 35 years and over accounted for the highest shares of ICT specialists included Italy (70.7 %), Finland (67.1 %), Sweden and Slovenia (both with 66.9 %). By contrast, a majority of ICT specialists aged 15-34 years was obtained in the Baltic Member States and in small Mediterranean countries where Lithuania, Latvia and Estonia accounted respectively for 51.4 %, 48.2 % and 43.8 %, encompassing Malta (with 51.1 %), Cyprus (46.0 %) and Croatia (45.3 %).
The three EFTA countries observed the same pattern of age distribution as most EU Member States, with people aged 35 years and over accounting for 62.5 % of the total number of ICT specialists in Switzerland, 61.3 % in Norway, and 60.4 % in Iceland. Candidate countries marked their difference when presenting a much younger pattern than the EU average: ICT specialists from the younger age group were in majority in Bosnia and in Türkiye whereas in Serbia the proportion is slightly lower with 46.6 %.
Source data for tables and graphs
Data sources
The data presented in this article are secondary statistics on ICT specialists derived from the Labour Force Survey (LFS). Data on ICT specialists cover persons working as ICT specialists in all parts of the economy; no analysis by economic activity is available.
Regulation (EU) 2019/1700 came into force on 1 January 2021 and induced a break in the LFS time series (the source data) for all EU Member States. More information on the source data can be found via the online publication EU Labour Force Survey, which includes articles on the technical and methodological aspects of the survey. The EU-LFS methodology in force from the 2021 data collection onwards is described in Methodology from 2021 onwards.
Statistics for ICT specialists are constructed on the basis of the OECD definition (outlined at the start of this article) which is built on the International Standard Classification of Occupations (ISCO). For data up until 2010, the definition was based on ISCO-88, whereas the data from 2011 onwards are based on ISCO-08; as such, there is a break in series in 2011. Under ISCO-08, Eurostat and the OECD define ICT specialists as people with the following occupations: ICT service managers; information and communications technology professionals (software and multimedia developers and analysts, and database specialists and systems administrators); information and communications technicians (ICT operations and user support technicians, and communications technicians); electronic engineers; telecommunication engineers; graphic and multimedia designers; information technology trainers; ICT sales professionals; electronics engineering technicians; electronics mechanics and servicers; ICT installers and servicers.
The International Standard Classification of Education (ISCED) provides a standard framework for education statistics. Data by level of educational attainment up until 2013 are classified according to ISCED 1997 and data from 2014 onwards are classified according to ISCED 2011, under which tertiary education is covered by levels 5-8. The 2011 edition of the ISCED classification defines education systems with respect to the following levels:
Level 0 — less than primary education;
Level 1 — primary education;
Level 2 — lower secondary education;
Level 3 — upper secondary education;
Level 4 — post-secondary non-tertiary education;
Level 5 — short-cycle tertiary education;
Level 6 — bachelor’s or equivalent level;
Level 7 — master’s or equivalent level;
Level 8 — doctoral or equivalent level.
For a more detailed listing and corresponding ISCO and ISCED codes, please refer to the metadata for statistics on ICT specialists in employment (see section on ‘Methodology’). Labour Force Survey reference metadata should be consulted for further information relating to the underlying primary source data.
Context
Digitalisation and automation can generate new business opportunities through the development of new production processes, new products and new markets. Indeed, the impact of information and communication technologies within the workplace has generally resulted in increased productivity and efficiency, as well as a range of possibilities for more flexible working practices. While these changes have generated a wide range of new jobs, the introduction of ICTs has also led to job losses, for example, as a result of automation.
Digital transformation is high on the European policy agenda, with making Europe fit for the digital age and empowering its citizens and businesses with a new generation of technologies being one of the main political priorities of the European Commission for the coming years.
On 9 March 2021, the Commission presented the Digital Decade Communication, which sets a vision and targets for a successful digital transformation of Europe by 2030. The Commission proposed a digital compass, which sets out a way for achieving the EU’s ambitions for a human-centred, sustainable and prosperous digital future. In particular, digitally skilled citizens and highly skilled digital professionals forms one of the fours cardinal point of the digital compass. The objective is to reach 20 million employed ICT specialists in the EU by 2030, coupled with a greater convergence of gender balance in taking up such jobs.
Monitoring the employment of ICT specialists is therefore important. In recent years, EU policies have given greater attention to ICT skills and in particular to the employment of ICT specialists as strong digital skills should strengthen the EU’s competitive position in the digital world and drive Europe towards a more equal society.
The new [1] launched to ensure that the right training, the right skills and the right support are available for people in the EU, have been extended to support cooperation between education, employment and industry to develop a pool of digital talent in the EU. Individuals and the labour force in general shall be equipped with adequate digital skills to prevent the loss of key ICT jobs in the European Union to other regions of the world.
In parallel, the European Commission is bringing together EU Member States and a range of stakeholders to pledge actions and to monitor progress in developing digital skills through the Digital Economy and Society Index.

