Employment
Within this section, data are presented for people aged 20–64. The choice of this age range reflects the growing proportion of young people who remain within education into their late teens (and beyond), potentially restricting their participation in the labour market, while at the other end of the age spectrum the vast majority of people in the EU are retired after the age of 64.
In recent decades, one of the EU’s main policy objectives has been to increase the number of people in work. This goal has been part of the European employment strategy (EES) from its outset in 1997 and was subsequently incorporated as a target in the Lisbon and Europe 2020 strategies. The employment rate is also included as one of the indicators in the social scoreboard which is used to monitor the implementation of the European Pillar of Social Rights. The EU has an employment rate target: by 2030, at least 78 % of the population aged 20–64 should be in employment.
The EU employment rate was 74.6 % in 2022
The employment rate is the ratio of employed persons (of a given age) relative to the total population (of the same age). Prior to the onset of the COVID-19 crisis, the EU’s employment rate for the working-age population (20–64 years) had increased for six consecutive years to 73.1 % by 2019; this pattern came to an abrupt end in 2020 as the rate fell 0.9 percentage points. In 2021, the EU’s employment rate recovered all of its loss during the initial stages of the pandemic. There was an even faster increase recorded in 2022 as the rate gained 1.5 percentage points to reach an historical high of 74.6 %.
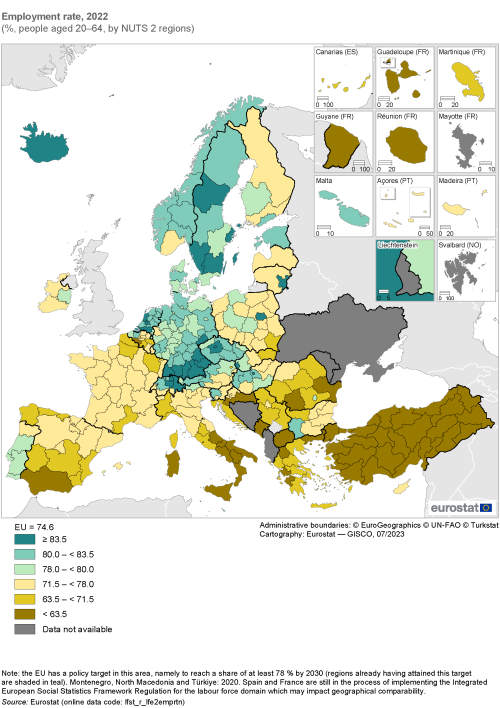
Map 1 presents the employment rate for NUTS level 2 regions: those regions with rates equal to or above the employment rate target of 78.0 % are shown in shades of teal. In 2022, more than two fifths of all regions (102 out of the 241 for which data are available; no recent data available for Mayotte in France) in the EU had already reached or surpassed this level. These regions were mainly concentrated in Czechia (all eight regions), Denmark (all five regions), Germany (36 out of 38 regions; the exceptions being Bremen and Düsseldorf), Estonia, Malta, the Netherlands (all 12 regions) and Sweden (all eight regions).
Looking in more detail, the highest regional employment rate in 2022 was recorded in the Finnish archipelago of Åland, at 89.7 %. Leaving this atypical region aside, the next highest rates were in the Polish capital region of Warszawski stołeczny (85.4 %), the Dutch region of Utrecht (85.1 %) and the Swedish capital region of Stockholm (also 85.1 %). There were several other capital regions with relatively high employment rates, including Budapest in Hungary (84.7 %), Bratislavský kraj in Slovakia (84.5 %), Praha in Czechia (84.4 %), Sostinės regionas in Lithuania (84.4 %), and Noord-Holland in the Netherlands (83.5 %).
At the other end of the range, the regions characterised by relatively low employment rates were often rural, sparsely-populated or peripheral regions of the EU. This pattern was apparent in Spain and Italy (particularly the southern parts), much of Greece, some regions in Romania and the outermost regions of France. Most of these regions were characterised by a lack of employment opportunities for people with intermediate and high skill levels.
Former industrial heartlands that have not adapted economically make up another group of regions characterised by relatively low employment rates. Some of these have witnessed the negative impact of globalisation on traditional areas of their economies (such as coal mining, steel or textiles manufacturing). Examples include a band of regions running from north-east France into the Région wallonne (Belgium).
Approximately one quarter (61 out of the 241 regions for which data are available) of all EU regions had an employment rate that was below 71.5 % in 2022 (as shown by the two darkest golden tones in Map 1). Among these, there were three regions in southern Italy – Sicilia, Calabria and Campania – where less than half of the working-age population was employed. The lowest regional employment rate was recorded in Sicilia, at 46.2 %.
(%, people aged 20–64, by NUTS 2 regions)
Source: Eurostat (lfst_r_lfe2emprtn)
The highest regional disparities for employment rates were observed in Italy
Within individual EU Member States, there were often considerable differences in employment rates between regions. For example, in most of the multi-regional eastern and Baltic Member States it was common to find the capital region had the highest employment rate, as was the case in Bulgaria, Czechia, Croatia, Lithuania, Hungary, Poland, Romania, Slovenia and Slovakia in 2022. This pattern was also observed in Denmark, Ireland, Greece and Sweden. However, the situation was reversed in a number of western Member States – for example, Belgium and Austria – where the capital region had one of the lowest regional employment rates.
Several EU Member States were characterised by regional disparities in their labour markets, with some regions having labour shortages, while others had persistently high unemployment rates. A population-weighted coefficient of variation provides one measure for comparing these intra-regional disparities. Figure 1 shows that in 2021 the highest regional disparities were recorded in Italy (a coefficient of variation of 17.5 %). Broadly, there was a north–south split between Italian regions: the northern Provincia Autonoma di Bolzano/Bozen recorded the highest employment rate (79.2 %), while the southern, island region of Sicilia had the lowest (46.2 %).
Belgium (8.8 %) and Spain (8.4 %) had the next highest coefficients of variation for employment rates. The former was also characterised by a north–south split, with relatively high rates recorded across the northern regions of Vlaams Gewest and generally lower rates across Région wallonne. In Spain, the highest employment rates were often located in northern and eastern regions, while lower rates tended to be observed in southern and western regions. At the other end of the range, the lowest regional disparities for employment rates – with a coefficient of variation that was less than 2.0 % – were recorded in the Netherlands and Denmark.
Figure 1 also shows that there was a modest degree of convergence for regional employment rates across the EU between 2011 and 2021, as the coefficient of variation fell from 11.9 % to 11.2 %. Eight (out of 17) EU Member States reported a decrease in their intra-regional disparities during this period, the biggest falls – in relative terms – being observed in Finland, Czechia and Hungary. By contrast, the largest increase was recorded in Poland, where regional disparities increased by more than one third; Portugal and Austria reported increases of more than one quarter.
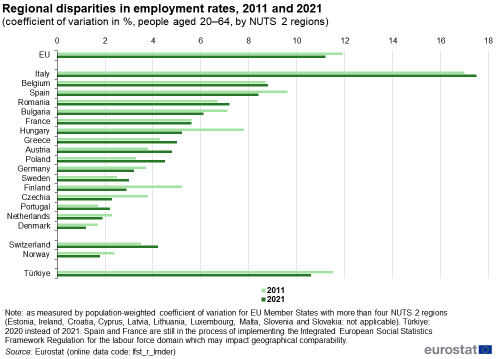
(coefficient of variation in %, people aged 20–64, by NUTS 2 regions)
Source: Eurostat (lfst_r_lmder)
The EU’s gender employment gap was 10.7 percentage points in 2022
In 2022, long-standing challenges linked to female participation in EU labour markets continued, as illustrated by persistent gender gaps for employment and pay. These gaps between the sexes exist for a variety of reasons, among which:
- women often bear a disproportionate share of unpaid care and household chores that may limit their availability for paid employment;
- gender bias and discrimination when hiring, promoting and paying women;
- fewer women in leadership positions to introduce gender-related policies or mentor more junior female staff;
- a lack of affordable childcare and support for working parents;
- disincentives in tax and benefit system that can lead to second earners bearing a higher tax burden when they choose to participate in the labour market;
- occupational segregation, with women often concentrated in specific activities that are characterised by lower wages and/or fewer opportunities for career development.
The gender employment gap is defined as the difference between the employment rates of men and women aged 20-64. The employment rate is calculated by dividing the number of persons aged 20–64 in employment by the total population of the same age group.
The European Pillar of Social Rights Action Plan set a subgoal of halving the EU’s gender employment gap; it forms part of the overall target to increase the EU’s employment rate to 78 % by 2030. The subgoal foresees halving the EU’s gender employment gap between 2019 and 2030 from its initial level of 11.7 percentage points to less than 5.8 points; this is equivalent to an average fall of 0.5 points each year. In 2022, the gender employment gap was 10.7 percentage points, some 0.2 points lower than in 2021 and 1.0 points lower than in 2019.
Sostinės regionas in Lithuania and Etelä-Suomi in Finland were the only regions across the EU where a higher proportion of working-age women (than men) were employed
Map 2 shows that in approximately one fifth (47 out of 241 regions for which data are available; no recent data available for Mayotte (France)) of all NUTS level 2 regions, the gender employment gap was already less than 5.8 percentage points in 2022; these regions are shown using three different golden tones in the map. They were concentrated in France (14 regions), Germany (seven regions), Finland (all five regions), Sweden and Portugal (both four regions), as well as both regions in Lithuania and Estonia. Those regions with relatively small gender employment gaps were generally characterised by high overall employment rates.
In Sostinės regionas (the capital region of Lithuania) and Etelä-Suomi (Finland), the employment rate of women aged 20–64 was higher than that recorded for men of the same age in 2022. The gender employment gap (in favour of women) was 1.2 percentage points in Sostinės regionas and 0.2 points in Etelä-Suomi; there was no difference in employment rates between the sexes in Pohjois- ja Itä-Suomi (also Finland).
Despite some progress being made, female employment rates still lag behind male rates in the vast majority of EU regions. The European Commission’s Gender Equality Strategy 2020–2025 is designed, among other goals, to counter gender stereotypes, promote women’s participation in decision-making, while closing gender gaps in the labour market. In general terms, EU regions with relatively large gender employment gaps were often characterised by higher unemployment rates and levels of inactivity among women.
There were 20 NUTS level 2 regions where the gender employment gap was at least 20.0 percentage points in 2022. Half of these were located in Greece, while the remainder were concentrated in Italy (seven regions) and Romania (three regions). The highest gender employment gaps were recorded in the Greek region of Sterea Elláda (31.4 percentage points) and the southern Italian region of Puglia (30.7 points).
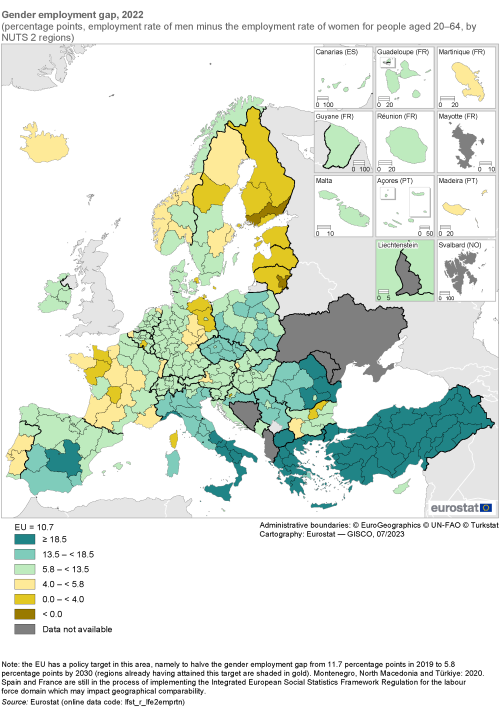
(percentage points, employment rate of men minus the employment rate of women for people aged 20–64, by NUTS 2 regions)
Source: Eurostat (lfst_r_lfe2emprtn)
Employment – focus on qualifications and skills
A number of EU Member States have, in recent years, enacted employment laws that seek to liberalise their labour markets, for example, by providing a wider range of possibilities for hiring staff through temporary, fixed-term or zero hours contracts. In some cases, this has resulted in a division between permanent full-time employees and those with more precarious employment contracts. The latter are often young people and/or people with relatively low levels of educational attainment. This may explain, at least to some degree, why young people in the labour market generally fare worse during economic downturns such as the COVID-19 crisis; during downturns, employers are also less likely to recruit new workers (young people coming into the labour market) or to replace older workers (who retire).
The share of young people (aged 15–29) who are neither in employment, nor in education or training (NEET) provides a useful measure for studying the vulnerability of young people in terms of their labour market and social exclusion. The NEET rate is expressed relative to the total population of the same age (15–29); note that the numerator includes not only young people who are unemployed but also young people who are outside the labour force for reasons other than education or training (for example, because they are caring for family members, volunteering or travelling, sick or disabled).
Within the European Pillar of Social Rights Action Plan, the EU set a policy target whereby the NEET rate should decrease to less than 9 % by 2030. Having peaked at 16.1 % in 2013 – during the aftermath of the global financial and economic crisis – the EU’s NEET rate fell at a relatively slow pace during six consecutive years, to 12.6 % in 2019. With the onset of the COVID-19 pandemic, the rate climbed to 13.8 % in 2020. The downward trend returned in 2021 and accelerated the following year when its largest decrease for more than a decade was observed. The EU’s NEET rate stood at 11.7 % in 2022.
Map 3 provides an analysis of the situation across 236 NUTS level 2 regions (see the note under the map for more details concerning data coverage). There were 21 regions across the EU where at least one fifth of all young people aged 15–29 were neither in employment, nor in education or training in 2022; these regions are shaded in the darkest tone of teal. Some of the highest NEET rates were recorded in southern and eastern EU Member States, as well as the outermost regions of France. More narrowly, there were eight regions where more than one quarter of all young people were neither in employment, nor in education or training:
- four of these were located in Italy – Puglia (26.0 %), Calabria (28.2 %), Campania (29.7 %) and Sicilia (32.4 %);
- three were located in Romania – Centru (25.5 %), Sud-Est (25.6 %) and Sud-Vest Oltenia (28.3 %);
- however, the highest NEET rate was recorded in the French outermost region of Guyane, where more than one third (33.9 %) of all young people were neither in employment, nor in education or training.
There were 74 NUTS level 2 regions that reported a NEET rate in 2022 that was already below the EU’s policy target of 9.0 % (to be reached by 2030); these are shown in Map 3 in golden tones. These regions were mainly concentrated in Belgium (7 out of 11 regions, principally located in the north), Denmark (four out of five regions), Germany (17 regions), the Netherlands (all 12 regions), Austria (six out of nine regions) and Sweden (all eight regions). At the lower end of the ranking, there were 11 NUTS level 2 regions that recorded a NEET rate of less than 5.0 %. All but one of these was located in the Netherlands; the only other was the southern Swedish region of Småland med öarna (4.4 %). The lowest rates were in Flevoland, Zuid-Holland, Noord-Brabant (all 3.8 %) and Overijssel (3.1 %).
There were two other patterns apparent across most EU Member States.
- Capital city regions generally recorded lower than (national) average shares of young people who were neither in employment nor in education or training. The only exceptions (among multi-regional EU Member States) were Belgium, Austria, Germany and the Netherlands; the difference in the latter was minimal.
- Former industrial heartlands had some of the highest NEET rates in their territories. For example, the three highest rates in Belgium (leaving aside the capital region) were registered in Prov. Namur, Prov. Liège and Prov. Hainaut, while relatively high rates were also recorded in the northern French regions of Champagne-Ardenne, Picardie and Nord-Pas de Calais.
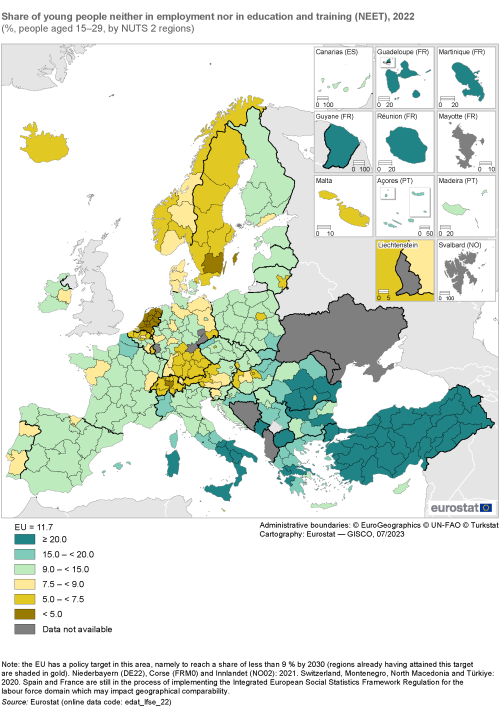
(%, people aged 15–29, by NUTS 2 regions)
Source: Eurostat (edat_lfse_22)
The highest regional disparities for the NEET rate were recorded in Hungary
The NEET rate can be used to analyse the share of young people who have not transitioned from education to employment. It is generally considered a more comprehensive measure than the unemployment rate, insofar as it is more closely linked to young people’s risk of social and labour exclusion. A population-weighted coefficient of variation provides one measure for comparing intra-regional disparities within individual EU Member States. In 2021, the highest regional disparities for the NEET rate – across NUTS level 2 regions – were recorded in Hungary, Bulgaria, Belgium, Greece and Italy. Within Hungary, the highest NEET rate was observed in Észak-Magyarország (17.7 %), which was three times as high as the lowest rate, which was recorded in the capital region of Budapest (5.9 %). By contrast, the lowest regional disparities were observed in the Netherlands and Sweden. For the latter, the highest NEET rate was recorded in Östra Mellansverige (7.4 %), some 3.0 percentage points above the rate reported in Småland med öarna (4.4 %).
Economic crises tend to hit young people disproportionately, as young people are more likely to work with temporary and other forms of atypical contract that are easier to terminate. The EU’s coefficient of variation for NEET rates across NUTS level 2 regions increased at a relatively fast pace between 2009 and 2013 – a period characterised by the impact of the global economic and financial crisis – from 37.9 % to 47.7 %. Between 2013 and 2018, regional disparities across the EU continued to widen – although at a slower pace. In 2019, there was a modest reduction in the EU’s coefficient of variation, which was followed by a more marked decline a year later, likely reflecting the impact of the COVID-19 crisis. The EU’s coefficient of variation for regional NEET rates increased once again in 2021, when it stood at 47.5 %.
Figure 2 shows that five EU Member States reported a narrowing of intra-regional disparities for the NEET rate during the period from 2011 to 2021; there was a modest pattern of convergence observed across the regions of Austria, Romania, Italy, Germany and Czechia. By contrast, regional disparities widened in all of the remaining Member States with more than four NUTS 2 regions; the most rapid increases were recorded in Hungary and Greece.
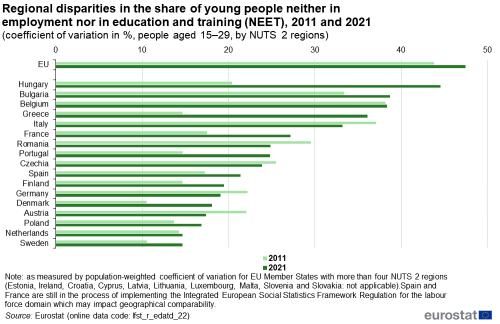
(coefficient of variation in %, people aged 15–29, by NUTS 2 regions)
Source: Eurostat (lfst_r_edatd_22)
Maps 4–6 are presented for the subpopulation of people aged 25–64. This age group represents a cohort of individuals who have generally completed their education or training and are most likely to be actively participating in the labour market. As such, it excludes younger individuals who may still be studying, as well as older individuals who may be transitioning into or already in retirement.
An individual’s level of educational attainment plays a key role when seeking employment. Persons with a tertiary level of educational attainment (as defined by ISCED 2011 levels 5–8) generally enjoy the most success when trying to find work and they also tend to be better shielded from the risks of unemployment than their peers with lower levels of attainment. In 2022, the EU employment rate for people aged 25–64 with a tertiary level of educational attainment was 87.4 %. The regional distribution was somewhat skewed: of the 241 NUTS level 2 regions for which data are available (no information for Mayotte in France), there were 146 – or 60.6 % of all regions – where the employment rate for people with a tertiary level of educational attainment was equal to or above the EU average.
The highest regional employment rate for people with a tertiary level of educational attainment was observed in Região Autónoma dos Açores in Portugal …
At the top end of the distribution, there were 23 regions in the EU where the employment rate of people aged 25–64 with a tertiary level of educational attainment was at least 91.5 % in 2022 (as shown by the darkest shade of blue in Map 4). This group was largely concentrated in eastern EU Member States, with six regions located in Poland, five in Hungary, three in Romania and single regions from each of Bulgaria and Slovakia. It also featured three regions from Portugal, as well as Prov. Oost-Vlaanderen in Belgium, Sostinės regionas (the capital region of Lithuania), Niederbayern in Germany, and Malta. The highest rate was recorded in the Portuguese Região Autónoma dos Açores, at 94.7 %.
Across the EU Member States, the employment rate of people aged 25–64 with a tertiary level of educational attainment was generally higher than the national average in capital city regions. These regions often act as a magnet for highly-qualified people, exerting considerable ‘pull effects’ through the varied educational, employment and social/lifestyle opportunities that they offer. This was particularly the case in Croatia and Greece, as the employment rates for people with a tertiary level of educational attainment were at least 3.0 percentage points higher in their capital regions than their national average; relatively large gaps were also observed in Poland, Bulgaria, Lithuania and Slovakia. By contrast, the opposite pattern was observed in several western EU Member States – Belgium, Austria, Germany and the Netherlands – as their capital regions recorded relatively low employment rates for people with a tertiary level of educational attainment; this was also the case in Portugal.
… by contrast, the lowest rate was recorded in the Greek region of Dytiki Makedonia
There were 22 NUTS level 2 regions where the employment rate of people aged 25–64 with a tertiary level of educational attainment was less than 80.0 % in 2022 (these regions are denoted by a yellow shade in Map 4). They were concentrated in southern EU Member States: 10 regions in Greece, eight regions in Italy and four regions in Spain. The lowest employment rate was recorded in the north-western Greek region of Dytiki Makedonia, at 69.0 %. The southern Italian region of Calabria was the only other region in the EU to report a rate that was below 70.0 %; there were three southern Italian regions and two regions in Greece with employment rates within the range of 70.0–75.0 %. Almost all of the 22 regions where less than 80.0 % of people aged 25–64 with a tertiary level of educational attainment were in employment were characterised as rural regions, with relatively large agricultural sectors and few employment opportunities for highly-skilled people.
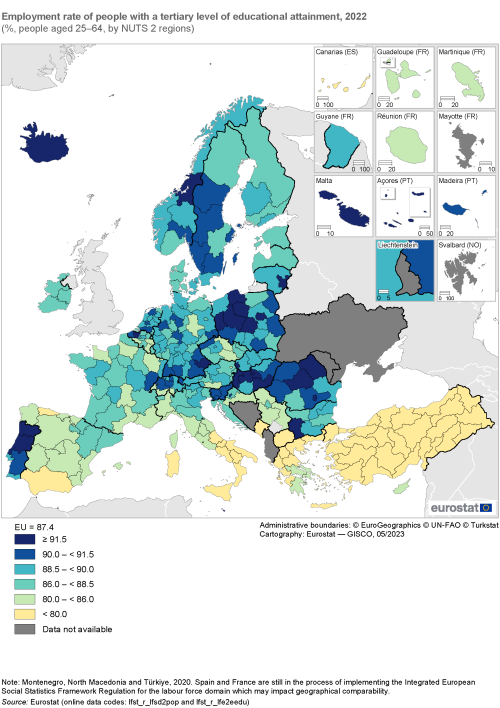
(%, people aged 25–64, by NUTS 2 regions)
Source: Eurostat (lfst_r_lfsd2pop) and (lfst_r_lfe2eedu)
Approximately one in five people with a tertiary level of educational attainment are over-qualified for the job they do
A New Skills Agenda for Europe (COM(2016) 381 final) and the European Skills Agenda for sustainable competitiveness, social fairness and resilience (COM(2020) 274 final) defined EU policy priorities and actions to be undertaken to improve the anticipation, development and activation of skills. The European Year of Skills 2023 is designed to ‘promote reskilling and upskilling, helping people to get the right skills for quality jobs’. Among their principal goals, these initiatives seek to ensure that the skills available in the labour market match those required by businesses and the economy.
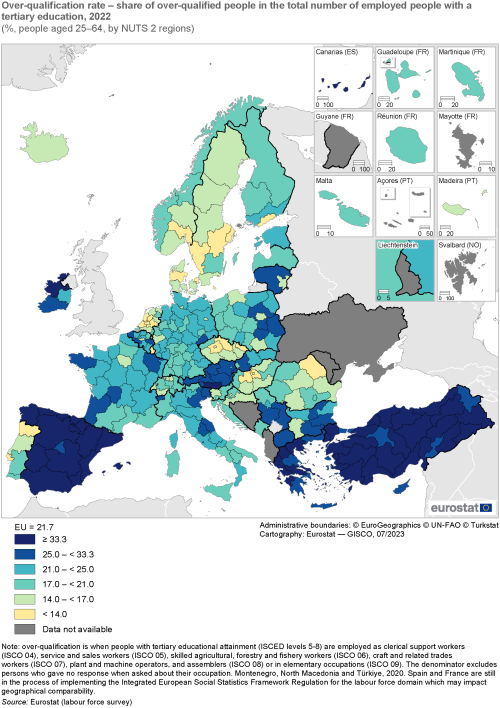
The gap between the demand for and supply of skills is referred to as the skills mismatch. Using data from the EU’s labour force survey, Eurostat has established an experimental indicator for the over-qualification rate, which provides one means of analysing discrepancies between educational attainment levels and occupations. The over-qualification rate is defined as: the share of employed persons (aged 25–64) with a tertiary level of educational attainment (as defined by ISCED 2011 levels 5–8) who are employed in low or medium-skilled occupations for which a tertiary education is generally not required (as defined by major groups 4–9 of the international standard classification of occupations (ISCO-08)). Low or medium-skilled occupations include clerical support workers; service and sales workers; skilled agricultural, forestry and fishery workers; craft and related trades workers; plant and machine operators, and assemblers; elementary occupations. This indicator may be used to measure imbalances in labour markets. During periods characterised by labour shortages, enterprises that have difficulties in recruiting staff may have to scale down their qualification requirements in order to fill a post. By contrast, during periods that are characterised by an excess supply of labour, enterprises that have no difficulties in filling a post may choose to increase their qualification requirements.
In 2022, more than one fifth (21.7 %) of the EU’s population aged 25–64 with a tertiary level of educational attainment who were employed were considered to be over-qualified. Of the 238 NUTS level 2 regions for which data are available (no data for Guyane and Mayotte in France, Região Autónoma dos Açores in Portugal or Åland in Finland), there were 107 regions (equivalent to 45.0 % of all EU regions) where the share was equal to or above the EU average. At the top end of the distribution, there were 26 regions where at least one third of this subpopulation was considered to be over-qualified (as shown by the darkest shade of blue in Map 5). The vast majority of these regions were concentrated in the southern EU Member States of Spain (17 regions) and Greece (seven regions); they were joined by the southern Austrian region of Kärnten and the Irish region of Northern and Western. The highest over-qualification rates were observed in the Greek island regions of Ionia Nisia (47.5 %) and Notio Aigaio (47.1 %), followed by the northern Spanish region of Cantabria (45.1 %) and the Spanish island region of Canarias (44.5 %). In Spain and Greece, it was commonplace to find rural regions recording some of the highest shares of over-qualified people, while more urban regions tended to have somewhat lower shares. In absolute terms, the biggest numbers of over-qualified people were reported in three Spanish regions – Cataluña (558 400), Andalucía (462 100) and Comunidad de Madrid (434 100) – and the French capital region of Ile-de-France (446 800).
At the bottom end of the distribution, there were 23 NUTS level 2 regions where less than 14.0 % of people aged 25–64 with a tertiary level of educational attainment were considered to be over-qualified in 2022 (as shown by the yellow shade in Map 5). Most of these were capital city regions and/or regions characterised by relatively high standards of living. Although spread across 10 different EU Member States, they were concentrated in four Member States: five regions located in the Netherlands, four in Czechia and three in Hungary and Sweden. These 23 regions included the capital regions of the Netherlands, Finland, Portugal, Denmark, Hungary, Czechia, Croatia and Sweden, as well as Luxembourg (a single region at this level of detail). The lowest shares of over-qualified people were reported in Luxembourg (6.3 %) and the Swedish capital region of Stockholm (8.9 %).
A recent communication from the European Commission, Harnessing talent in Europe’s regions (COM(2023) 32 final), highlighted increasing global competition for talent (as many developed world economies are expected to face shrinking populations in the years to come). The communication identified demographic transformation as a cause for concern in a number of EU regions (for more information on population developments, see Chapter 1), with shrinking working-age populations and the potential departure of young and skilled workforces to other regions/territories leading to a talent development trap. It acknowledged these challenges may limit the capacity of some regions to build sustainable, competitive and knowledge-based economies, while regional disparities within the EU could be further exacerbated by other structural transformations, such as technological change or the transition to a climate-neutral economy.
With this in mind, the European Commission launched a talent booster mechanism in early 2023 with the aim of supporting EU regions that were affected by a decline in their working-age populations through training, retaining and attracting the people, skills and competences needed to address the demographic transition. It is the first key initiative contributing towards the European Year of Skills.
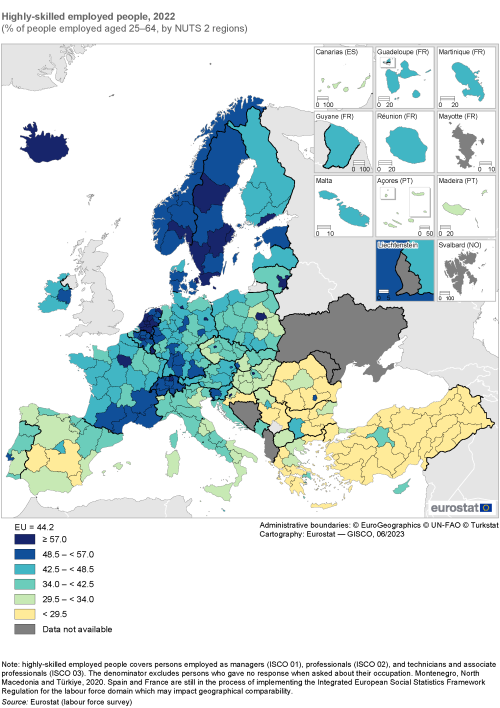
Employed people with high-skills are defined – for the purpose of this publication – as people aged 25–64 who are employed in the following occupations: managers; professionals; or technicians and associate professionals (ISCO-08 major groups 1–3). In 2022, there were approximately 80 million highly-skilled people employed across the EU; they accounted for 44.2 % of the total number of people employed aged 25–64.
Map 6 shows the share of highly-skilled employed people for NUTS level 2 regions. In 2022, the regional distribution was somewhat skewed: 106 out of 241 regions for which data are available (no data for Mayotte in France) reported a share of highly-skilled employed people that was equal to or above the EU average. There were 53 regions across the EU where at least half of all employed persons aged 25–64 were considered to be highly-skilled. The highest shares of highly-skilled employed people were in capital regions and other urban regions: these regions tend to ‘pull’ highly-qualified individuals through a wide array of job prospects in dynamic sectors of the economy and may also offer a diverse range of cultural and social opportunities. Looking in more detail, 12 out of the 14 regions across the EU with the highest shares of highly-skilled employed people were capital regions: the two exceptions were the Belgian Prov. Brabant Wallon (65.8 %) and the Dutch region of Utrecht (68.9 %). The capital regions of Belgium, France, Lithuania, Hungary, Finland, Germany, Poland, the Netherlands, Denmark and Czechia all reported shares within a relatively narrow range – from 62.6–65.6 %. A somewhat higher proportion of highly-skilled employed people was recorded in Luxembourg (a single region at this level of detail; 67.4 %), while a peak of 73.6 % was observed in the Swedish capital region of Stockholm. At the other end of the range, the lowest proportions of highly-skilled employed people among capital regions were recorded in the Greek capital region of Attiki (41.8 %) and the Italian capital region of Lazio (40.5 %); Cyprus (a single region at this level of detail) had a lower share (39.8 %).
Many of the EU regions experiencing the impact of declining working-age populations and struggling to retain and attract highly-skilled individuals are rural regions. However, outermost and peripheral regions, as well as former industrial heartlands struggling with the transition to new industrial structures are also affected. This broad range of diverse regions may be collectively referred to as ‘regions that have been left behind’. In 2022, there were 24 NUTS level 2 regions in the EU where highly-skilled employed people accounted for less than 29.5 % of total employment among those aged 25–64 (these regions are denoted by a yellow shade in Map 6). This group was principally concentrated in the south-eastern corner of Europe, with 10 regions in Greece, six in Romania, and four in Bulgaria; it also included three sparsely-populated regions in the southern half of Spain and Panonska Hrvatska in Croatia. The central Greek region of Sterea Elláda had the lowest regional share of highly-skilled employed people (21.8 %), closely followed by another Greek region – Ionia Nisia (22.3 %) – and the southern Romanian region of Sud-Muntenia (22.8 %). The lowest share of highly-skilled employed people among western EU Member States was recorded in the eastern French region of Lorraine (37.0 %), while the lowest share among northern EU Member States was recorded in the Lithuanian region of Vidurio ir vakarų Lietuvos regionas (40.0 %).
Unemployment
Unemployment can have a bearing not just on the macroeconomic performance of a country (lowering productive capacity) but also on the well-being of individuals without work and their families. Rising unemployment results in a loss of income for individuals, increased pressure with respect to government spending on social benefits and a reduction in tax revenues. Furthermore, the personal and social costs of unemployment are varied and include a higher risk of poverty and social exclusion, debt or homelessness, while the stigma of being unemployed may have a potentially detrimental impact on (mental) health.
Within this section, data are presented for people aged 15–74; this is the standard age range employed by Eurostat and the International Labour Organization (ILO) for analyses of unemployment rates. Note also that contrary to what may be thought, the unemployment rate is not the direct opposite of the employment rate, since the two measures do not have the same denominator; the unemployment rate uses the active labour force and the employment rate uses the total population.
The EU unemployment rate was 6.2 % in 2022
After six consecutive years of falling unemployment rates between 2013 and 2019 – from a peak of 11.6 % down to a low of 6.8 % – the EU’s unemployment rate among people aged 15–74 increased with the onset of the COVID-19 crisis. It rose 0.4 percentage points in 2020, with no change recorded the following year, as the pandemic continued to impact some parts of the economy. In 2022, there was a marked reduction in unemployment across the EU, as labour shortages became apparent in certain sectors of the economy and in several EU Member States characterised by tight labour markets. There were 13.3 million unemployed people in 2022, while the unemployment rate fell to 6.2 % (in other words, lower than it had been prior to the pandemic).
Map 7 shows unemployment rates across NUTS level 2 regions: the highest rates – as shown by the darkest shade of blue in the map – were principally recorded in southern and outermost regions of the EU. By contrast, the lowest rates – shown in yellow – were largely concentrated in a cluster of regions that stretched from Germany into Poland, Czechia and Hungary. The distribution of unemployment rates across NUTS level 2 regions exhibited a certain degree of skewness. There were 99 regions (out of 238 for which data are available; no recent data are available for Trier in Germany, Mayotte in France, Lubuskie in Poland or Åland in Finland) that had unemployment rates equal to or above the EU average of 6.2 %, while there were 139 regions that recorded rates below the EU average.
In 2022, there were 25 NUTS level 2 regions in the EU that reported unemployment rates of at least 12.5 %. They were concentrated in Greece and Spain (nine regions in each), four outermost regions of France, as well as three regions in southern Italy. The Spanish autonomous regions of Ciudad de Ceuta and Ciudad de Melilla were the only regions in the EU to record unemployment rates that were higher than 20.0 %. Leaving these aside, the next highest rate was also recorded in Spain, in the southern region of Andalucía (19.0 %).
There were 26 NUTS level 2 regions which recorded unemployment rates of less than 2.5 % in 2022. As noted above, they were largely concentrated in Germany, Poland, Czechia and Hungary; there were also relatively low unemployment rates in Provincia Autonoma di Bolzano/Bozen (northern Italy), Bratislavský kraj (the capital region of Slovakia) and Prov. Oost-Vlaanderen (northern Belgium). The lowest unemployment rates in the EU were recorded in the Czech regions of Střední Čechy (that surrounds the capital) and Praha (the capital region), at 1.2 % and 1.6 % respectively. There were six other regions that recorded unemployment rates below 2.0 %: Közép-Dunántúl in Hungary, two other regions in Czechia – Jihozápad and Jihovýchod, Niederbayern (2021 data) in southern Germany, and Pomorskie and Warszawski stołeczny in Poland (the latter being the capital region).
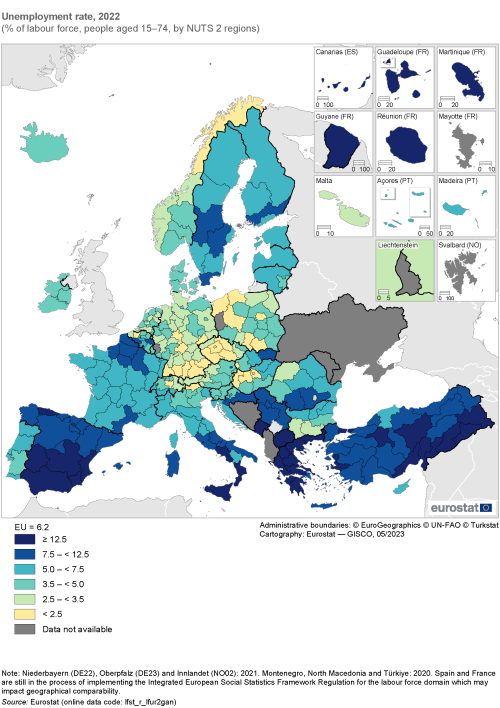
(% of labour force, people aged 15–74, by NUTS 2 regions)
Source: Eurostat (lfst_r_lfu2gan)
The highest regional disparities for unemployment rates were observed in Italy, Belgium and Austria
A population-weighted coefficient of variation provides one measure for comparing intra-regional disparities within EU Member States. Figure 3 shows that the highest regional disparities in 2021 for unemployment rates were recorded in Italy, Belgium and Austria (with coefficients higher than 50.0 %):
- in Italy, the highest regional unemployment rate was recorded in Campania (17.1 %) and the lowest in Provincia Autonoma di Bolzano/Bozen (2.3 %), with a clear north–south divide in regional unemployment rates;
- in Belgium, the highest regional unemployment rate was recorded in Région de Bruxelles-Capitale / Brussels Hoofdstedelijk Gewest (11.4 %) and the lowest in Prov. Oost-Vlaanderen (2.0 %), with a clear divide in regional unemployment rates between the regions of Vlaams Gewest and those of Région wallonne;
- in Austria, the highest regional unemployment rate was recorded in Wien (9.2 %), which was more than twice as high as the next highest rate (4.5 % in Kärnten) and the lowest in Oberösterreich (2.9 %).
It is interesting to note that although the capital regions of Belgium and Austria are among the richest regions in the EU (in terms of GDP per inhabitant), they also paradoxically experienced relatively high unemployment rates and a higher risk of poverty and social exclusion. It should be noted that the data on GDP reflect where the GDP was generated, rather than the place of residence of workers that contributed to that GDP; as such, it is influenced by flows of commuters across regional borders.
At the other end of the range, the lowest regional disparities – with coefficients of variation below 10.0 % – were observed in Denmark, Portugal and Finland. For example, the highest regional unemployment rate in Finland was recorded in Etelä-Suomi (7.6 %) and the lowest in Länsi-Suomi (6.3 %).
Figure 3 also shows there was an increase in regional disparities for unemployment rates across the whole of the EU between 2011 and 2021, as the coefficient of variation rose from 58.2 % to 64.1 %. During the period under consideration, double-digit percentage point increases were recorded in Hungary, Bulgaria, Poland and Austria, as their regional disparities widened. By contrast, regional unemployment rates in Germany and Finland converged at a relatively rapid pace.
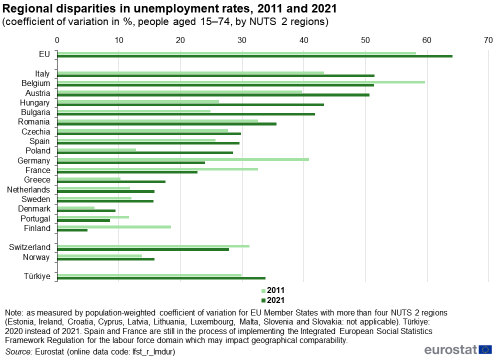
(coefficient of variation in %, people aged 15–74, by NUTS 2 regions)
Source: Eurostat (lfst_r_lmdur)
Unemployment statistics – based on the share of the labour force without work but looking for and being available to work – may underestimate the overall demand for employment, as besides unemployed people, there are other groups who may be interested in extending their working hours or returning to the labour force. To better reflect this potential demand, an indicator for labour market slack has been developed. This takes account of i) unemployed people, ii) underemployed part-time workers (who want to work more), iii) people who are available to work but are not looking for work, and iv) people who are looking for work but are not immediately available to work. While the first two of these subpopulations form part of the labour force, the other two are outside it and may be considered as part of the potential additional labour force. Labour market slack is defined as the total unmet demand for employment, expressed in relation to the ‘extended labour force’, which includes: i) people in the labour force (unemployed and employed), and ii) people in the potential additional labour force (available to work but not seeking, and seeking work but not immediately available).
In 2022, labour market slack among people aged 15–74 across the EU amounted to 12.3 % of the extended labour force. Less than half of this figure (5.9 %; note that the denominator here is the extended labour force, not the labour force) corresponded to unemployed people, while 3.0 % were available to work but not seeking, 2.6 % were underemployed persons working part-time, and 0.8 % were seeking work but not immediately available.
Map 8 shows labour market slack for NUTS level 2 regions. As for the unemployment rates shown in Map 7, its regional distribution was somewhat skewed, insofar as 140 out of 240 regions (no recent data available for Mayotte in France and Åland in Finland) reported shares below the EU average, with the remainder (41.7 % of all regions) recording shares that were equal to or above the EU average. There was a stark spatial divide: unmet demand for employment accounted for a relatively high share of the extended labour force in several of the southern EU Member States and outermost regions, while labour market slack contributed a relatively low share of the extended labour force in most eastern EU Member States.
The highest shares of labour market slack – at least 21.0 % of the extended labour force in 2022 – are shown by the darkest shade of blue in Map 8. They were concentrated in just four of the EU Member States: nine regions in Spain, seven regions in Italy, four regions in Greece, and four outermost regions of France. A peak of 38.9 % was recorded in Guyane (France) and Sicilia (Italy), while two more southern Italian regions – Campania and Calabria – and the autonomous Spanish region of Ciudad de Ceuta also recorded shares that were above 35.0 %.
At the other end of the range, the lowest levels of labour market slack – less than 4.5 % of the extended labour force – are shown in the lightest shade of yellow in Map 8. These 23 regions were concentrated across eastern EU Member States and included the capital regions of Bulgaria, Czechia, Hungary, Poland, Romania and Slovakia. This group also included Malta and two regions located in southern Germany – Oberpfalz and Niederbayern. The lowest share was observed in the Czech region of Střední Čechy, at 1.5 %, while there were five other regions where labour market slack accounted for less than 3.0 % of the extended labour force:
- three were located in Czechia, Jihozápad, Jihovýchod and the capital region of Praha;
- the Slovak capital region of Bratislavský kraj;
- the western Polish region of Lubuskie.
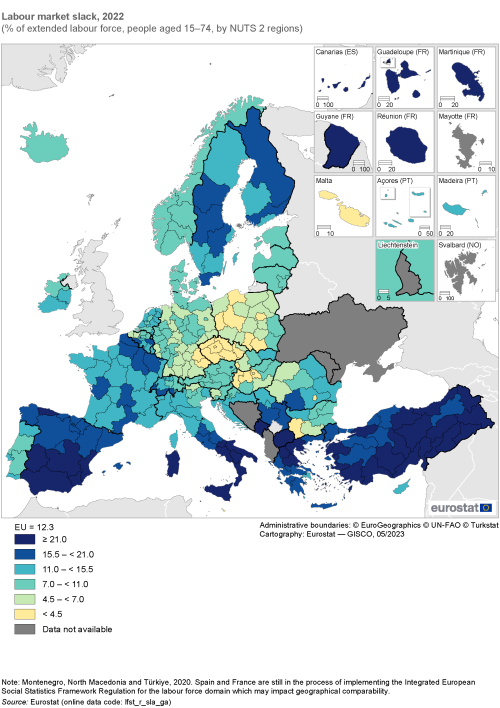
(% of extended labour force, people aged 15–74, by NUTS 2 regions)
Source: Eurostat (lfst_r_sla_ga)
Source data for figures and maps
Data sources
The information presented in this chapter relates to annual averages derived from the labour force survey (LFS). Eurostat compiles and publishes labour market statistics for the EU, individual EU Member States, as well as EU regions. In addition, data are also available for several EFTA countries – Iceland, Norway and Switzerland – and candidate countries – Montenegro, North Macedonia, Serbia and Türkiye – and their statistical regions. The LFS population generally consists of persons aged 15 and over living in private households; definitions are aligned with those provided by the International Labour Organization (ILO).
LFS microdata are collected through a survey to obtain information on an individual’s demographic background, labour status, employment characteristics of their main job, hours worked, employment characteristics of their second job, time-related underemployment, the search for employment, education and training, previous work experience of persons not in employment, their situation one year before the survey, their main labour status and their income. These statistics are aggregated by region and are generally published down to NUTS level 2. Some regional labour market statistics are compiled/transmitted for NUTS level 3 regions, although this is on a voluntary basis.
When analysing regional information from the LFS, it is important to bear in mind that the information presented relates to the region where the respondent has his/her permanent residence and that this may be different to the region where their place of work is situated as a result of commuter flows.
The collection of LFS data up to and including reference year 2020 was conducted by national statistical authorities in accordance with Council Regulation (EEC) No 577/98 of 9 March 1998. There is a new legal basis for LFS data from 2021 onwards: Regulation (EU) 2019/1700 of the European Parliament and of the Council of 10 October 2019 establishing a common framework for European statistics relating to persons and households, based on data at individual level collected from samples and Commission Implementing Regulation (EU) 2019/2240 of 16 December 2019 specifying the technical items of the data set, establishing the technical formats for transmission of information and specifying the detailed arrangements and content of the quality reports on the organisation of the sample survey in the labour force domain in accordance with Regulation (EU) 2019/1700. This new legal basis implies a break in series between 2020 and 2021; results obtained before and after 1 January 2021 are consequently not fully comparable.
Changes in survey methodology led to a break in series for German data in 2020. Therefore, data for Germany should not be compared directly with that for previous years. In addition, data collection during 2020 was impacted by technical issues and COVID-19 measures and hence there is a low degree of reliability for some regions. For more information, see this note.
Note also that the labour force survey sample for Corse (in France) was too small to have reliable regional results and that Mayotte (France) is covered by a specific annual survey. As a result, data for these two regions should also be considered with caution.
Indicator definitions
Employed person
In the context of the LFS, an employed person is a person aged 15–89 who, during the reference week, performed work – even if just for one hour – for pay, profit or family gain. Alternatively, the person was not at work, but had a job or business from which he or she was temporarily absent due to illness, holiday, maternity or paternity leave, job-related training or short or paid parental leave. This definition follows resolutions of the International Conference of Labour Statisticians (the ICLS is hosted by the ILO). Note that within this publication, most labour force indicators are presented for the cohort of working-age, defined here as those persons aged 20–64.
Employment rate
The employment rate is the percentage of employed persons in relation to the comparable total population. For the overall employment rate, the comparison is generally made within the population of working-age (defined within this publication as people aged 20–64).
Employment rates may also be calculated for a particular age group and/or sex – for example, males aged 15–29. In a similar vein, employment rates may also be calculated for other subpopulations according to a range of socioeconomic criteria, for example, employment rates by level of educational attainment. Within this publication, the employment rate of people with a tertiary level of educational attainment concerns persons aged 25–64 who had successfully completed a tertiary level of education (as defined by the international standard classification of education (ISCED) levels 5–8) – in other words, persons who had completed a short-cycle tertiary education, bachelor’s, master’s or doctoral degree (PhD).
The gender employment gap is defined as the employment rate of men minus the employment rate of women among people aged 20–64.
Highly-skilled employed people
The most commonly used approaches for measuring the demand for skills include making use of data on qualifications (educational attainment) or occupations. Both of these datasets are available from within the LFS; this publication gives preference to data based on occupations.
Data on occupations provide indications of the type of jobs undertaken by those in employment. Occupations are considered to be a good indirect measure for skills demand and their distribution across an economy. The international standard classification of occupations (ISCO) allocates jobs to occupations, based on a description that takes into account the level of qualifications and the types of tasks to be carried out. Highly-skilled employed people are defined as persons employed as managers (ISCO 01), professionals (ISCO 02), technicians and associate professionals (ISCO 03). To have consistency with the age classes presented for alternative indicators about qualifications and skills and to exclude younger persons who may not have had the prospect/opportunity of getting a job requiring a high-skill level, the data for this indicator are shown for persons aged 25–64. It is defined as the share of highly-skilled employed people in the total number of persons employed; the denominator excludes persons who gave no response when asked about their occupation.
Labour force
The labour force includes all people who were either employed or unemployed during the reference week. This aggregate includes all persons offering their work capacity on the labour market: as such it reflects the supply side of the market.
Labour market slack
Labour market slack refers to the sum of all unmet employment demands and includes four groups: i) unemployed people as defined by the ILO; ii) underemployed part-time workers (in other words, part-time workers who want to work more); iii) people who are available to work but are not looking for work; and iv) people who are looking for work but are not available for work. While the first two of these groups are in the labour force, the last two, also referred to as the ‘potential additional labour force’, are both outside the traditional scope of the labour force.
Over-qualification rate
Over-qualified workers are defined as employed persons who have attained a tertiary level of educational attainment (ISCED levels 5–8) and who work in occupations for which a tertiary education level is not required. The latter (defined as ISCO 04–09) includes: clerical support workers; services and sales workers; skilled agricultural, forestry and fishery workers; craft and related trades workers; plant and machine operators and assemblers; and elementary occupations.
This is an experimental indicator, defined as the share of over-qualified people in the total number of employed people with a tertiary education. Data are presented for persons aged 25–64. Although not yet methodologically grounded, the indicator gives a useful insight for labour market analyses. Note that over-qualification can signal an excess supply of labour with high qualifications, but may also reflect businesses which have no difficulties in filling a post increasing their required level of qualifications.
Regional disparities in labour force indicators
Regional labour market disparities are based on the population-weighted coefficient of variation. Calculations are made only for EU Member States that have more than four NUTS level 2 regions. As such, data are not presented for Estonia, Ireland, Croatia, Cyprus, Latvia, Lithuania, Luxembourg, Malta, Slovenia and Slovakia. Note that the coefficient of variation calculated for the EU as a whole includes all regions of the EU, not just those of Member States that have more than four NUTS level 2 regions.
Unemployed person
Eurostat‘s unemployment statistics are based on resolutions of the International Conference of Labour Statisticians (the ICLS is hosted by the ILO). An unemployed person is defined as someone aged 15–74 who is without work, but who has actively sought employment in the four weeks preceding the reference week (or has already found a job to start within the subsequent three months) and is available to begin work within the following two weeks.
Unemployment rate
The unemployment rate is defined as the number of unemployed persons expressed as a percentage of the total labour force.
Young people neither in employment nor in education or training (NEET)
The share of young people who are neither in employment nor in education and training, abbreviated as NEET, corresponds to the share of the population (of a given age group and sex) that is not employed and not involved in further (formal or non-formal) education or training (during the four weeks preceding the survey). The numerator refers to persons meeting these two conditions, while the denominator is the total population (of the same age group and sex), excluding those respondents who did not answer the question (in the survey) about participation in regular (formal) education and training. For the purpose of this publication the share of young people neither in employment nor in education or training relates to those aged 15–29.
Context
There are six European Commission priorities for 2019–2024, including the creation of ‘An economy that works for people’, whereby the EU seeks to create a more attractive investment environment and growth that creates quality jobs, especially for young people and small businesses. Some of the principal challenges outlined by President von der Leyen include: fully implementing the European Pillar of Social Rights; ensuring that workers have at least a fair minimum wage; promoting a better work-life balance; tackling gender pay gaps and other forms of workplace discrimination; getting more disabled people into work; and protecting people who are unemployed.
Since the end of 2019, the European Commission has contributed to the implementation of the social pillar principles with, among other initiatives, the following.
At the beginning of March 2021, the European Commission outlined the European Pillar of Social Rights Action Plan. It provides specific actions to implement the principles of the European Pillar of Social Rights through the active involvement of social partners and civil society. Furthermore, it proposes a number of employment, skills and social protection targets to be achieved by 2030. Two of the headline targets relate specifically to labour markets: at least 60 % of adults should be in training; at least 78 % of people aged 20–64 should be in employment.
The European Social Fund Plus (ESF+) is the EU’s main instrument dedicated to investing in people. It aims to build a more social and inclusive EU. Regulation (EU) 2021/1057 of the European Parliament and of the Council establishing the European Social Fund Plus (ESF+) entered into force on 1 July 2021 providing a key financial instrument for implementing the European Pillar of Social Rights and supporting a post-pandemic recovery. The ESF+ has a total budget of €99.3 billion for the period 2021–2027 and aims to support people by creating and protecting job opportunities, promoting social inclusion and fighting poverty; it has ambitious goals for investing in young people and addressing child poverty. It also aims to encourage high employment levels, fair social protection and a skilled and resilient workforce ready for the transition to a green and digital economy.
New digital and green technologies will likely bring about a rapid transformation in the types of jobs that are available and different ways of working. As such, policymakers are seeking ways to promote investment in skills and training so that the EU has a workforce with the necessary skills to boost innovation, improve competitiveness, and contribute towards sustainable growth. Indeed, in 2023 the European Year of Skills was launched during which various stakeholders will work together to promote skills development:
- helping people to get the right skills for quality jobs;
- promoting investment in training and upskilling, enabling people to stay in their current jobs or find new ones;
- matching people’s aspirations and skills set with opportunities on the job market, especially for the green and digital transitions and the economic recovery;
- helping businesses, in particular small and medium-sized enterprises, to address skills shortages, while ensuring workforce skills match the needs of employers, by closely cooperating with social partners and business;
- attracting people from outside the EU with (additional) skills that are needed to drive forward sectors that have been identified as having strategic relevance.
As part of this initiative, the European Commission made two proposals in April 2023 for Council Recommendations designed to improve digital skills, education, and training. During the European Year of Skills, the European Commission will propose, among others:
- an update of the European Quality Framework for Traineeships designed to strengthen the quality of traineeships and support the training and labour market participation of young people;
- an initiative to improve the recognition of qualifications of non-EU citizens in order to attract workers with the skills needed, together with the launching of talent pool to facilitate international recruitment;
- a plan to renew the learning mobility framework to enable more learners and educators than before to study and teach abroad.

