Overview
The Labour Force Survey (EU-LFS) is the source of data for this article. The focus of this article is the age group 20–64 years. This age group is of particular interest as it is the focus for employment analyses in the Action Plan on Integration and Inclusion 2021–2027.
Three main indicators of employment conditions are presented in this article. The overview focuses on an analysis of these three indicators by citizenship and by country of birth. The following three sections – one for each indicator – present more detailed information by citizenship only, since similar patterns can be observed for the analysis by country of birth.
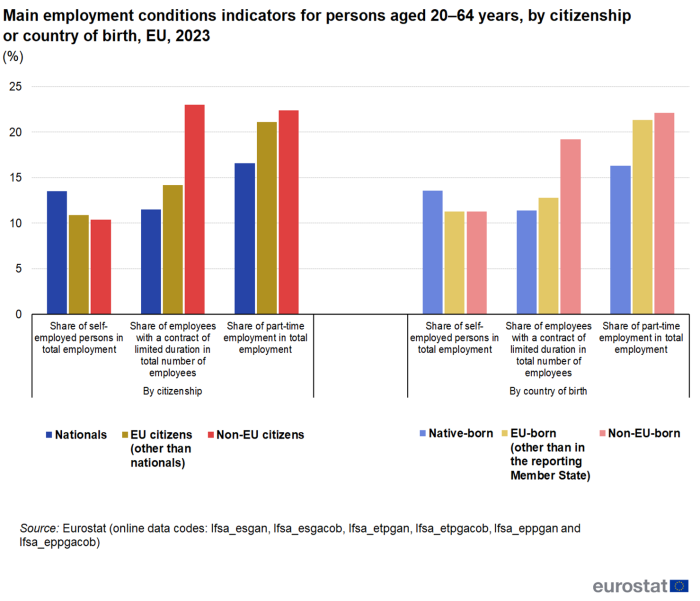
In the EU, 13.5 % of nationals were self-employed in 2023 – see Figure 1. This was more than the shares observed for citizens of other Member States (10.9 %) and for non-EU citizens (10.4 %).
Among employees living in the EU, 11.5 % of nationals had a contract of limited duration in 2023. In other words, they were temporary employees. For citizens of other Member States, the share was 14.2 %, while for non-EU citizens (23.0 %), the share was double that for nationals.
In the EU, 16.6 % of nationals worked part time in 2023. This share was notably higher among citizens of other Member States (21.1 %) and among non-EU citizens (22.4 %).
When analysed by country of birth rather than by citizenship, a similar pattern can be observed. However, the differences between the three categories of country of birth were narrower (than for the categories of citizenship) for the share of employees with a contract of limited duration and somewhat narrower for the share of self-employment.
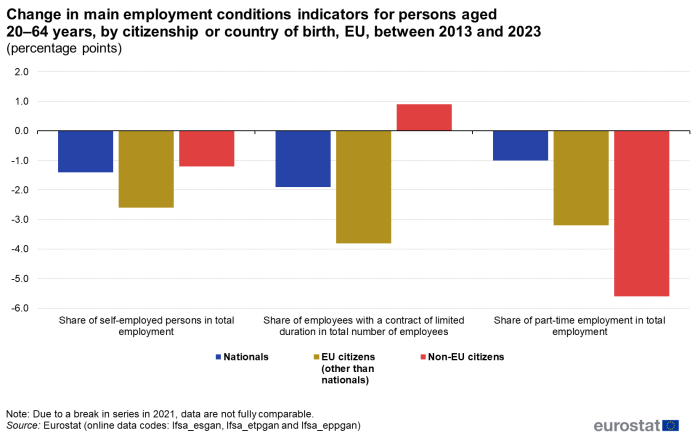
(percentage points)
Source: Eurostat (lfsa_esgan), (lfsa_etpgan) and (lfsa_eppgan)
Between 2013 and 2023, the share of self-employment decreased in the EU, regardless of citizenship – see Figure 2. The fall in this share was strongest among citizens of other Member States (down 2.6 percentage points (pp)), while the smallest decrease was observed for non-EU citizens (down 1.2 pp).
The share of employees in the EU with a contract of limited duration increased between 2013 and 2023 by 0.9 pp among non-EU citizens. By contrast, the share of employees with a contract of limited duration decreased between 2013 and 2023 by 1.9 pp among nationals and by 3.8 pp among citizens of other Member States.
Between 2013 and 2023, the share of part-time employment decreased in the EU, regardless of citizenship: notably larger decreases were observed for the two categories of foreign citizens (down 3.2 pp for citizens of other Member States and 5.6 pp for non-EU citizens) than for nationals (down 1.0 pp).
Self-employment
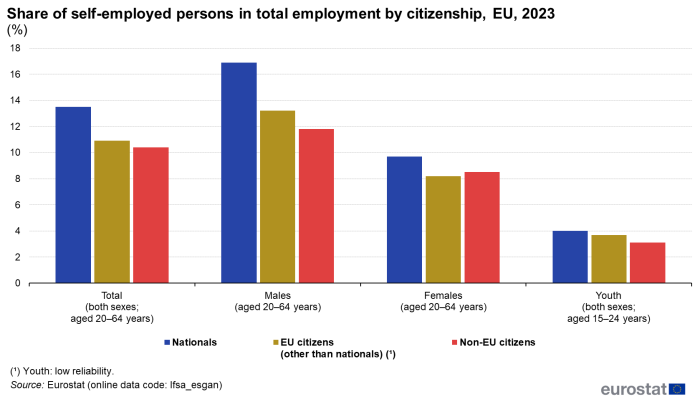
Self-employed persons are defined as persons who work in their own business (including professional practices, farms, shops and other businesses) for the purpose of earning a profit. Considering the population of employed people, for males and females aged 20–64 years as well as for young people (aged 15–24 years), self-employment was more common in the EU in 2023 among nationals than among foreign citizens (either of the two categories).
- For people aged 20-64, the difference between the shares of self-employed nationals and citizens of other EU countries was 2.6 pp, while the difference was higher (3.1 pp) between the nationals and non-EU citizens.
- For self-employed males, the difference between nationals and foreigners was more pronounced than for self-employed females of the same age group.
- Among males aged 20–64 years, the difference between the two categories of foreign citizenship was 2.3 pp, with a higher share for male citizens of other Member States than male non-EU citizens.
- Among females aged 20–64 years, the difference between the two categories of foreign citizenship was 0.3 pp, with a slightly lower share for female citizens of other Member States than female non-EU citizens.
- The difference between the two categories of foreign citizenship among young people accounted for 0.6 pp; it was higher for citizens of other Member States (low reliability data) than non-EU citizens.
(%)
Source: Eurostat (lfsa_esgan)
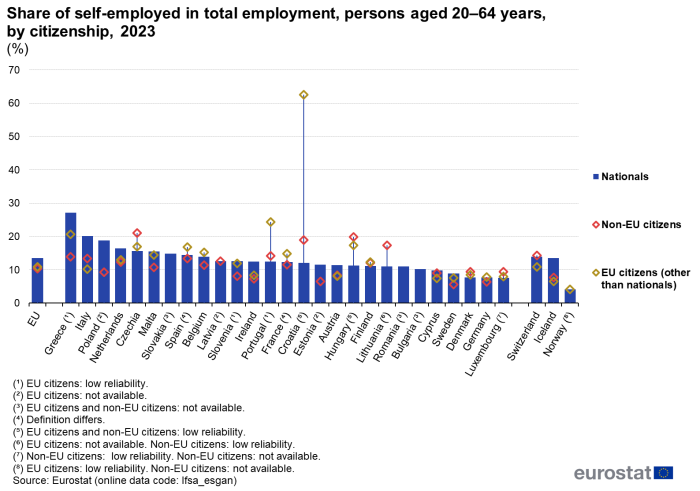
Among EU contries, the highest share of self-employment among total employment in 2023 for nationals was in Greece (27.1 %) followed by Italy (20.1 %) and Poland (18.8 %) – see Figure 4. Most of the remaining countries reported self-employment shares above 10.0 %, with lower shares in Cyprus, Sweden, Denmark, Germany and Luxembourg (where the lowest share was recorded, 7.6 %).
For citizens of other Member States, the highest share of self-employed persons in total employment was 17.0 % in Greece, while the lowest was 7.5 % in Cyprus (note that reliable data are available for 15 Member States). In seven Member States, the share of self-employment was higher for nationals than for citizens of other Member States. This gap was widest in Italy (9.8 pp) and in Ireland (4.1 pp). Among the eight Member States where the self-employment share was higher among citizens of other Member States, the widest gaps were in France (2.6 pp) and in Spain (2.4 pp).
For non-EU citizens (reliable data available for 20 Member States), the share of self-employed persons in total employment ranged from 21.1 % in Czechia to 5.6 % in Sweden. In most Member States with reliable data (15 of 20), the share of self-employment was higher for nationals than for non-EU citizens. This gap was widest in Greece (13.1 pp), Poland (9.5 pp) and in Italy (6.7 pp). Among four Member States where the self-employment share was higher among non-EU citizens, the widest gap was in Czechia (5.4 pp). The shares were equal in Latvia.
(%)
Source: Eurostat (lfsa_esgan)
Employees with a contract of limited duration
Employees are individuals who work for a public or private employer and who in return receive compensation in the form of wages, salaries, payment by results, or payment in kind; non-conscript members of the armed forces are also included. Employees are not self-employed or contributing family workers. An employee is considered as having a temporary job if employer and employee agree that its end is determined by objective conditions: in such cases the employee has a contract of limited duration (as opposed to one of unlimited duration).
Looking at the population of employees, for males and females aged 20–64 years, the share of employees with a contract of limited duration in the EU in 2023 was lower among nationals (11.5 %) than among citizens of other Member States (14.2 %), which in turn was lower than the share among non-EU citizens (23.0 %) – see Figure 5. The difference between the shares for nationals and citizens of other Member States was narrower (8.8 pp) than the gap for nationals and non-EU citizens (11.5 pp).
For young employees (aged 15–24 years), the share of employees with a contract of limited duration in the EU in 2023 was considerably higher than for employees aged 20–64 years. Furthermore, among young employees the share with a contract of limited duration did not vary greatly by citizenship ranging between 44.8 % for citizens of other Member States and 48.5 % for nationals.
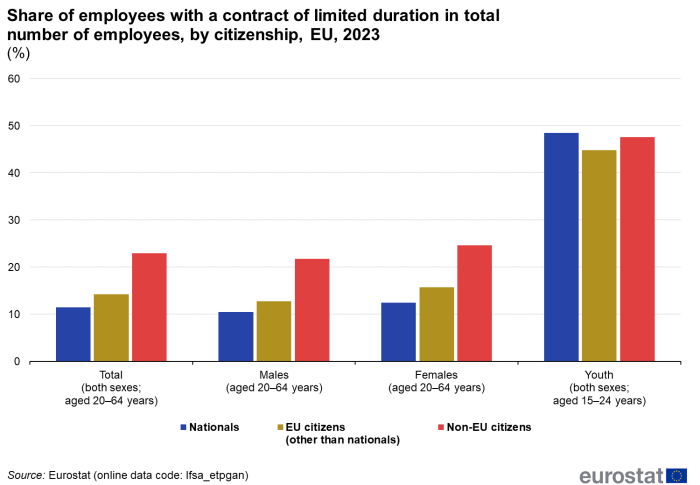
(%)
Source: Eurostat (lfsa_etpgan)
Among Member States, the highest shares of employees with a contract of limited duration in 2023 were in the Netherlands (22.7 %) and Spain (16.1 %) – see Figure 6. Most of the remaining Member States reported shares above 5.0 %, with lower shares in Hungary, Slovakia, Bulgaria, the Baltic Member States and Romania. The lowest share was recorded in Lithuania (1.7 %).
For citizens of other Member States, in 2023, the highest shares of employees with a contract of limited duration in total number of employees were 36.7 % in Greece and 29.8 % in the Netherlands. The lowest share was 4.5 % in Ireland (note that reliable data are available for 15 Member States). In most Member States (13 from 15), this share was higher for citizens of other Member States than for nationals. This gap was widest in Greece (26.7 pp) and the Netherlands (7.1 pp). Among the two remaining Member States the share was lower among citizens of other Member States, with the gap of 2.9 pp observed for Spain and 2.4 pp for Ireland.
For non-EU citizens, four of the 18 Member States for which reliable data are available, recorded shares of employees with a contract of limited duration in total number of employees above 40.0 %. The highest share observed was 53.9 % in Cyprus and the lowest 8.8 % in Ireland. In all 18 Member States for which reliable data are available, the share of employees with a contract of limited duration was higher for non-EU citizens than for nationals. This gap was largest in Cyprus (47.2 pp) while it was narrowest in Ireland (1.9 pp).
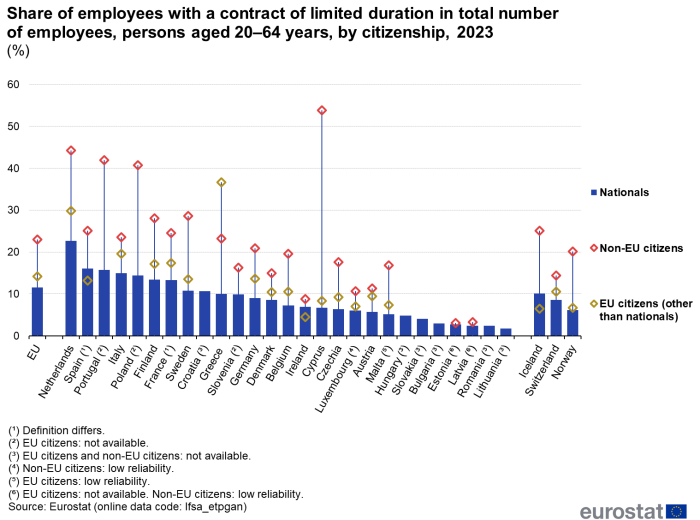
(%)
Source: Eurostat (lfsa_etpgan)
Part-time employment
The distinction between full-time and part-time work is generally based on a spontaneous response by a respondent to the labour force survey. Among employed males and females aged 20–64 years, the share of part-time employment in the EU in 2023 was lower among nationals than among citizens of other Member States, which in turn was lower than the share among non-EU citizens – see Figure 7.
- The shares of part-time employment were considerably higher for females than for males among all categories of citizenship ranging from 27.1 % for nationals to 36.5 % for non-EU citizens, whereas the shares for males ranged from 7.4 % for nationals to 12.2 % for non-EU citizens.
- The difference between the shares for nationals and citizens of other Member States was considerably narrower for males (0.8 pp) than for females (8.9 pp).
- The shares for the two categories of foreign citizenship were quite different among males with a 4.0 pp difference between the shares for citizens of other Member States and for non-EU citizens but quite similar among females (0.5 pp).
For young persons (aged 15–24 years) in employment, the proportions working part-time in the EU in 2023 were slightly lower for young non-EU citizens (32.6 %) than for nationals (33.5 %) and EU-citizens (33.0 %). The shares of young persons working part-time were higher than for employed persons aged 20–64 years. The difference was particularly large and more than double for nationals, reflecting the relatively low shares for nationals aged 20–64 years (as the shares of young persons who worked part-time did not vary greatly between the three categories of citizenship).
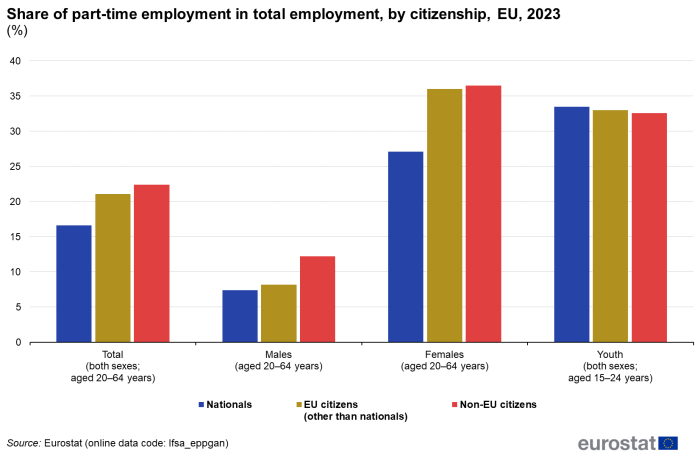
(%)
Source: Eurostat (lfsa_eppgan)
For nationals, the highest share of part-time employment in 2023 among Member States was in the Netherlands (39.7 %) – see Figure 8. This share was also above one quarter in Austria (30.8 %) and Germany (28.8 %). Five Member States reported part-time employment shares below 5.0 %, with the lowest share in Bulgaria (1.4 %).
For foreign citizens, there was a somewhat narrower range among the Member States in the share of part-time employment in 2023:
- for citizens of other Member States, the highest share was 28.8 % in Austria while the lowest was 7.7 % in Czechia (note that reliable data are available for 15 Member States);
- for non-EU citizens, the share ranged from 30.0 % in the Netherlands to 6.0 % in Malta (reliable data available for 19 Member States).
Despite the relatively clear pattern for the EU as a whole, the situation among the Member States varied.
- In six Member States (out of 15 for which reliable data are available), part-time employment in 2023 was more common among citizens of other Member States than among nationals. This gap was widest in Italy (5.4 pp) and in France (4.9 pp). Among the nine Member States where the part-time employment share was lower among citizens of other Member States, the widest gaps were in the Netherlands (13.1 pp) and Luxembourg (8.8 pp).
- In around half of the Member States (9 from 19 for which reliable data are available) the share of part-time employment was higher for non-EU citizens than for nationals. This gap was widest in France (7.1 pp) and in Italy (6.6 pp). Among the ten Member States where the part-time employment share was lower among non-EU citizens, the widest gaps were in the Netherlands (9.7 pp) and Luxembourg (6.2 pp).
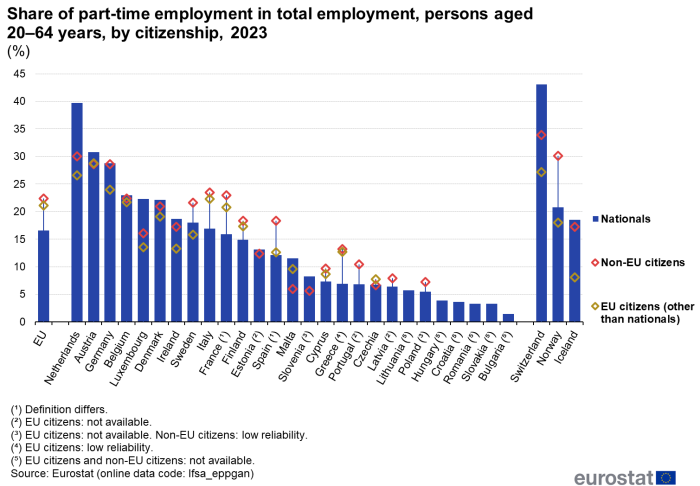
(%)
Source: Eurostat (lfsa_eppgan)
Source data for tables and graphs
Data sources
The data presented in this article are from the labour force survey (LFS), the largest household sample survey in the EU. The survey covers the resident population, defined as all people usually residing in private households. As such, persons living in collective households are excluded from the target population. Usual residence means the place where a person normally spends the daily period of rest, regardless of temporary absences for purposes of recreation, holidays, visits to friends and relatives, business, medical treatment or religious pilgrimage. The data for the EU are aggregated results for the 27 Member States. For more information on the data sources used, please consult the online publication EU labour force survey.
Due to the sampling nature of the survey, some data have low reliability or are not published due to very low reliability or confidentiality. Data that are of low reliability are duly marked in the footnotes below the figures and tables.
Main concepts
An employed person is someone aged 15–89 years who, during the reference week of the labour force survey, performed work – even if just for one hour a week – for pay, profit or family gain. Also included are people who were not at work but had a job or business from which they were temporarily absent.
An employee is a particular type of employed person. Employees work for a public or private employer and receive compensation in the form of wages, salaries, payment by results, or payment in kind; non-conscript members of the armed forces are also included. Employees are not self-employed or contributing family workers.
Self-employed persons are defined as persons who work in their own business (including professional practices, farms, shops and other businesses) for the purpose of earning a profit.
An employee is considered as having a temporary job if employer and employee agree that its end is determined by objective conditions, such as a specific date, the completion of an assignment, or the return of an employee who is temporarily replaced: in such cases the employee has a contract of limited duration (as opposed to one of unlimited duration).
The distinction between full-time and part-time work is generally based on a spontaneous response by a respondent to the labour force survey.
Country notes
Spain and France have assessed the attachment to the job and included in employment those who, in their reference week, had an unknown duration of absence but expected to return to the same job once health measures allow it.
Context
In November 2020, an Action Plan on Integration and Inclusion 2021–2027 (COM(2016) 377 final) was adopted with the purpose of fostering social cohesion and building inclusive societies for all. Inclusion for all is about ensuring that all policies are accessible to and work for everyone, including migrants and EU citizens with migrant background. This plan includes actions in four sectoral areas (education and training, employment and skills, health and housing) as well as actions supporting effective integration and inclusion in all sectoral areas at the EU, Member State and regional level, with a specific attention paid to young people.
More information on the policies and legislation in force in this area can be found in an introductory article on migrant integration statistics.

