Quarterly comparison in the EU and euro area
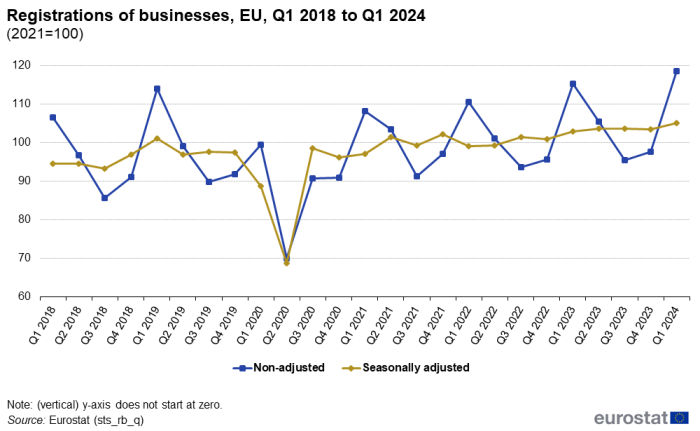
The number of registrations of new businesses in the EU was not following a clear trend from the beginning of 2018 until the end of 2019, with a slight level increase over this period. This was followed by significant decreases in the first and second quarters of 2020, and then a recovery again in the third quarter of 2020. There was no clear trend in the number of registrations between the fourth quarter of 2020 and the fourth quarter of 2023, however a slight level increase was recorded over this period and thus the highest levels of registrations were reached (since 2018) in Q2 2023 and Q3 2023. In the first quarter of 2024, registrations rose again and reached the highest level since 2018, surpassing the previous peak from the third quarter of 2023 (Figure 1).
Source: Eurostat (sts_rb_q)
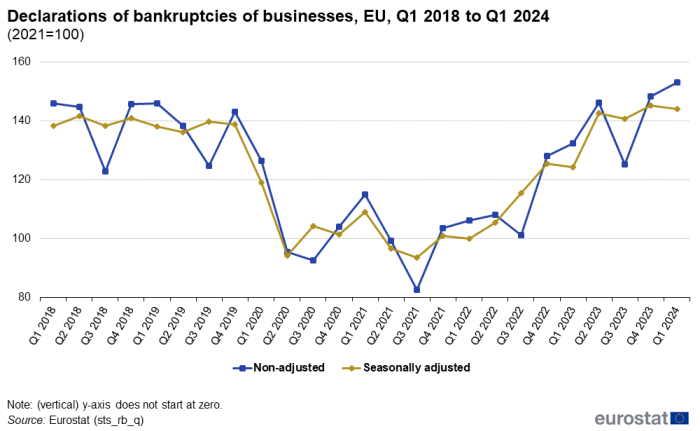
Regarding the number of declarations of bankruptcies, there was no clear trend between the first quarter of 2018 and the fourth quarter of 2019. There were considerable decreases in the first and second quarters of 2020. The decrease in bankruptcies, observed in many Member States in the first two quarters of 2020, can be explained by the government measures supporting businesses during the beginning of the COVID-19 crisis which allowed the businesses to avoid declaring bankruptcy. After that, from the third quarter of 2020 until the first quarter of 2022, there was no clear trend in the number of bankruptcy declarations, while it still remained well below the pre-pandemic levels (i.e. between Q1 2018 and Q4 2019). Then, the bankruptcy declarations were mainly on an upward trend from Q2 2022 until Q4 2023, while reaching a new peak (since 2018) first in Q2 2023 and then yet another new peak in Q4 2023. In the first quarter of 2024, the number of bankruptcy declarations slightly decreased, while still remaining above the pre-pandemic levels (between Q1 2018 and Q4 2019) (Figure 2).
Source: Eurostat (sts_rb_q)
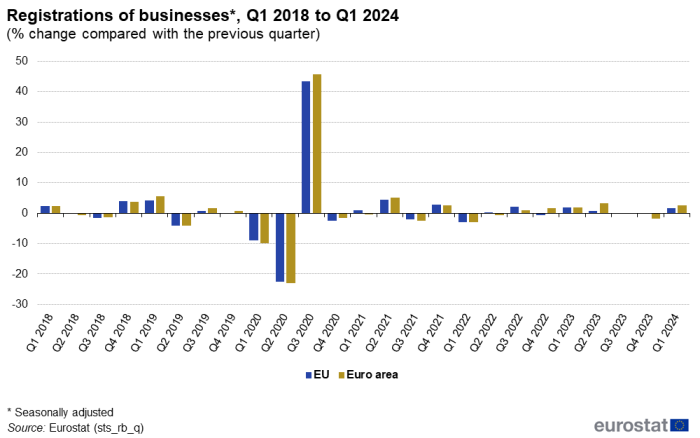
In the first quarter of 2024, the seasonally adjusted number of registrations of businesses was up by 1.6 % in the EU and by 2.6 % in the euro area, compared with the fourth quarter of 2023. In the fourth quarter of 2023, the number of registrations of businesses was down by 0.2 % in the EU and by 1.8 % in the euro area, compared with the third quarter of 2023 (Figure 3).
Source: Eurostat (sts_rb_q)
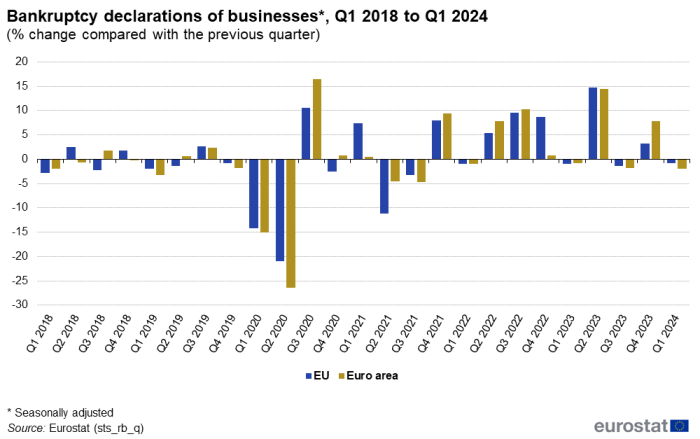
In the first quarter of 2024, the seasonally adjusted number of declarations of bankruptcies decreased by 0.8 % in the EU and by 2.0 % in the euro area, compared with the fourth quarter of 2023. In the fourth quarter of 2023, declarations of bankruptcies increased by 3.2 % in the EU and by 7.8 % in the euro area, when compared with the third quarter of 2023 (Figure 4).
Source: Eurostat (sts_rb_q)
Quarterly comparison by Member State
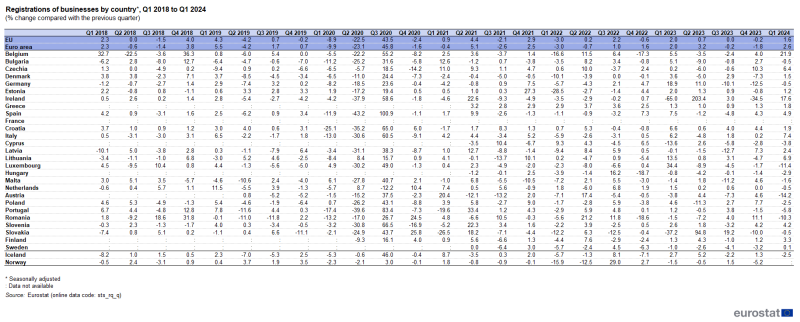
Comparing the first quarter of 2024 with the fourth quarter of 2023, among the EU Member States, the most increases in registrations of new businesses were observed in Belgium (+21.9 %), Ireland (+17.6 %) and Italy (+7.4 %). The largest decreases in registrations of new businesses were observed in Austria (-14.2 %), Luxembourg (-11.4 %) and Romania (-10.3 %) (Table 1).
Source: Eurostat (sts_rb_q)
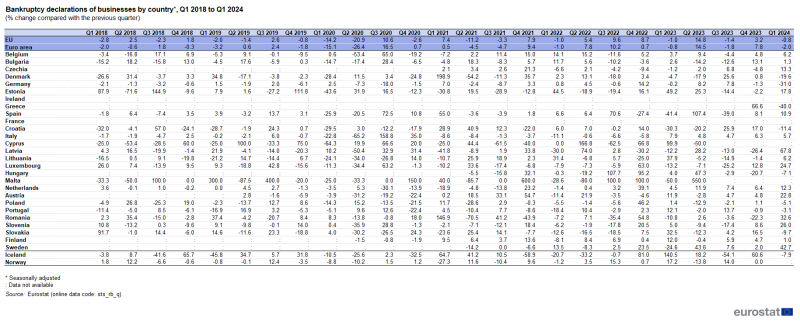
Comparing the first quarter of 2024 with the fourth quarter of 2023, among Member States, the highest increases in bankruptcy declarations were observed in Latvia (+67.8 %), Sweden (+42.7 %) and Romania (+32.6 %). The largest decreases in the number of declarations of bankruptcies were recorded in Greece (-40.0 %), Germany (-31.0 %) and Denmark (-19.6 %) (Table 2).
Source: Eurostat (sts_rb_q)
Quarterly comparison by activity
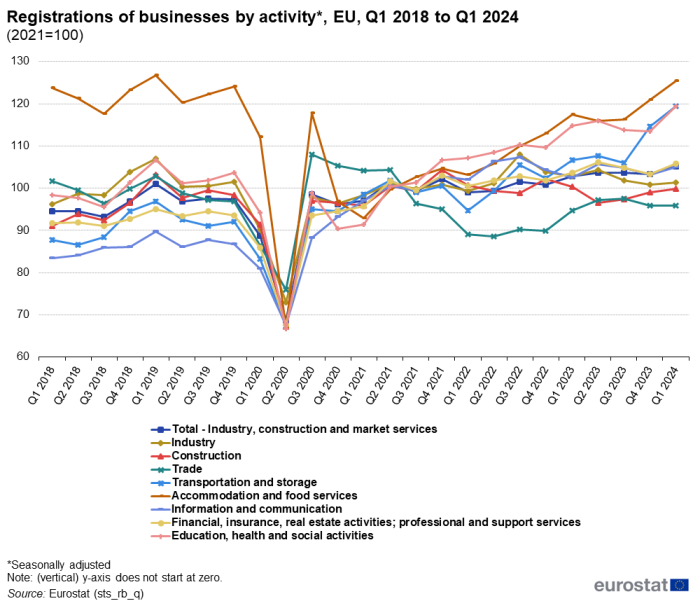
For all sectors of the economy, the number of registrations of new businesses was not following a clear trend from the beginning of 2018 until the end of 2019. The number of new registrations dropped sharply in all sectors of the economy in the first and second quarters of 2020 (linked to the COVID-19 pandemic), and recovered again in the third quarter of 2020. From the fourth quarter of 2020 until third quarter of 2022, the businesses registrations in most sectors of the economy were on an upward trend, with the exceptions being trade, and construction.
Comparing the first quarter of 2024 with the fourth quarter of 2023, increases in the registrations of businesses were recorded in all sectors of the economy, with more articulated increases in education and health services, transport, and accommodation and food services.
In the first quarter of 2024, registrations of businesses remained at higher levels than before the COVID-19 crisis (fourth quarter of 2019) in most sectors of the economy. Only in trade, and industry, there were fewer businesses registered in the first quarter of 2024 than in the fourth quarter of 2019, before the COVID-19 pandemic (Figure 5).
Source: Eurostat (sts_rb_q)
For all sectors of the economy (industry, construction, market services), the number of declarations of bankruptcies was not following a clear trend from the beginning of 2018 until the end of 2019. In all sectors of the economy, there was a significant decrease in bankruptcy declarations in the first two quarters of 2020 (linked to the extraordinary financial support provided by governments in the first months of the pandemic). Then, form the third quarter of 2020 until the first quarter of 2022, the bankruptcy declarations were again not following any clear trend in all sectors of the economy. From the second quarter of 2022 until the second quarter of 2023, all sectors of the economy were on an upward trend.
In the fourth quarter of 2023, the number of bankruptcy declarations decreased in most sectors, with the exception of trade, accommodation and food services. Then, in the first quarter of 2024, the number of bankruptcies declarations increased in the majority of the sectors of the economy, with most significant rises, compared with the previous period, seen in transport, industry, and information and communication. On the other hand, the only two sectors where there were decrease in the number of bankruptcies were trade, and construction (Figure 6).
![A line chart showing the trend in declarations of bankruptcies in the EU by activity, from the first quarter of 2018 to the first quarter of 2024. Data are seasonally adjusted and 2021=100.]](https://ec.europa.eu/eurostat/statistics-explained/images/thumb/e/e3/F6Declarations_of_bankruptcies_by_activity_%2C_EU%2C_Q1_2018_to_Q1_2024.png/700px-F6Declarations_of_bankruptcies_by_activity_%2C_EU%2C_Q1_2018_to_Q1_2024.png)
Source: Eurostat (sts_rb_q)
Source data for tables and graphs
Annual bankruptcies in absolute figures
Following requests by users for getting access to annual data of bankruptcies in absolute values, these annual data (starting with reference year 2015) were first published as part of this article in February 2023 (and then updated in May 2023). With the current update of this article, the annual data of bankruptcies in absolute values is being refreshed once more and now also comprises the 2023 data.
The annual data are calculated by Eurostat, as the sum of the four quarters of the respective year, transmitted by the countries in line with the requirements of the European Business Statistics Regulation. Only the total number of bankruptcies is published per country, without any NACE breakdowns. In the same annual bankruptcies data file, a table has been added with: methodological notes comprising the definition of the bankruptcy in the countries; the legal forms included in the total number; and the source of the data. The publication of the annual data in the following data file covers all countries that agreed to have their data published.
Data sources
This publication is covered by the mandatory data collection and transmission on quarterly business registrations and bankruptcy declarations under the EBS Regulation. Data from Q1 2021 are mandatory for all Member States, except the bankruptcies for Ireland. The historical data before 2021 are based on voluntary transmissions. The data are also available in Eurostat’s reference database.
Since February 2023 also monthly data on business registrations and bankruptcy declarations are being released by Eurostat. The monthly data are collected and transmitted on a voluntary basis. The monthly data are also available in Eurostat’s reference database.
Methodology and definitions; differences between quarterly and annual business demography data
Registrations on new businesses: The number of entered legal units in the registration register at any time during the reference quarter Q, according to the respective administrative or legal procedure.
Registrations is an early indicator to measure business intentions. In every country, administrative rules of registrations differ, so the quarterly data are presented as an index series to improve comparability.
Registrations cannot be directly compared with enterprise births. Registrations of businesses are part of administrative procedures, while annual data on enterprise births are based on the start-up of business activity in terms of having turnover, employment or investment. The registration of a legal unit can be considered as a declaration of intent but does not necessarily mean it continues as a business activity in line with annual business demography concept. Registration data are not based on the enterprise demography characteristics ‘date of commencement of activities’ but rather on the ‘date of registration’ that is not necessarily the same.
The statistical unit in annual business demography statistics on births is the enterprise, while quarterly data on registrations refer to legal units (several legal units can constitute one enterprise, a registration of a new legal unit therefore does not necessarily mean the birth of a new enterprise). In some countries the coverage of legal forms or of NACE activities in quarterly registrations compared with annual births in business demography may differ. Annual business demography may have a threshold with respect to turnover in order to be included in the statistics concerned. Registrations and births may also be recorded in different reference periods or years.
Due to the methodological differences, there is no direct comparability with annual business demography statistics on births of enterprises.
Bankruptcies: The number of legal units that have started the procedure of being declared bankrupt, by issuing a court declaration, at any time during the reference quarter Q (this declaration is often provisional and does not always mean cessation of an activity).
The bankruptcies indicator is an early sign to measure the sentiment in business environment. Quarterly statistics on bankruptcies are frequently different from annual business demography statistics on deaths of enterprises, because they cover deaths of enterprises due to bankruptcies, as well as other reasons. Bankruptcies that were filed do not necessarily mean closing of the business. Even if an enterprise has declared bankruptcy, it does not always mean that it ceases all activity when it enters into bankruptcy procedure. In order to be recorded as an enterprise death in annual business demography typically all production factors have been dissolved.
There are several methodological differences between the concepts of bankruptcies and enterprise deaths. Quarterly business demography data on bankruptcies are based on legal units, while annual business demography data on deaths is based on the statistical unit enterprise. Moreover, in some countries self-employed persons are rarely subject to bankruptcy procedure. There may also be significant differences between countries with respect to bankruptcy laws. In some countries, when a business declares itself bankrupt, it means that it has to cease immediately all activities whereas in other countries, they can continue to trade under a certain operation control. Some businesses declaring themselves bankrupt may therefore eventually recover, and would therefore not be considered as an enterprise death. The proportion of bankruptcy procedures that finally end up as an enterprise death varies therefore across countries depending on the bankruptcy laws. In addition, minimum thresholds of e.g. turnover may apply to annual business demography data, but not necessarily to quarterly data on bankruptcies.
To conclude, the scope and contents of annual business demography statistics on deaths of enterprises may differ considerably from quarterly data on bankruptcies and the levels of these two statistics may therefore vary considerably. In general, bankruptcies represent only a fraction of all enterprise deaths; they cannot be directly compared with annual business demography data on deaths of enterprises.
Respective strengths of quarterly and annual data: The quarterly data on registrations and bankruptcies reflect the intention of a business to start economic activities or to close down activities. The annual data reflect the economic reality in terms of enterprises having turnover, employment or investment (births) or the dissolution of them (deaths).
Calculation of indexes and EU aggregates
The available national indices are calculated by dividing the absolute figures of each period by the average of the base year (2021). National absolute figures are not directly aggregated because of different legislations, administrative practices and economic structures of the Member States.
Some countries asked for their data not to be used for the estimation of the European aggregates due to the evolving national methodology of registering bankruptcy declarations.
The EU aggregates are calculated by weighting the national indices by the number of active enterprises, taken from structural business statistics of the reference year 2021.
In this publication, the seasonally adjusted EU series are calculated indirectly by calculating the weighted average of the available seasonally adjusted national indices.
Context
Monitoring registrations and bankruptcies on a quarterly basis is useful as it provides more up-to-date and frequent information on the economic environment for businesses than the traditional annual business demography statistics. Quarterly data is very helpful to track better the effects of the COVID-19 pandemic in 2020 and 2021, and the impact of Russia’s invasion of Ukraine on European businesses. This is particularly important for policy makers when policy responses are needed due to business cycle developments in the current context.
Since the first quarter of 2021, the data on the absolute numbers of registrations of new businesses and bankruptcies are provided by the national statistical institutes of the EU Member States, on a mandatory basis in accordance with the provisions of Regulation (EU) No 2019/2152 on European business statistics.

