R&D expenditure
R&D – creative and systematic work undertaken to increase the stock of knowledge or to devise new applications of existing knowledge – tends to be concentrated in clusters. Research-intensive regions are often situated around academic institutions, high-technology industrial activities and/or knowledge-based services, which attract new start-ups and highly qualified personnel. Gross domestic expenditure on R&D (GERD) includes research expenditure made by business enterprises, higher education institutions, government and private non-profit organisations. In 2020, GERD was valued at €310.0 billion across the EU. Despite the considerable economic impact of the COVID-19 crisis, it can be noted that there was only a modest reduction (down 0.6 %) in the level of expenditure on R&D compared with 2019. In 2021, there was a rebound in activity, as GERD increased 5.9 % to €328.5 billion.
R&D activity was clustered in a small number of regions across the EU; more than three quarters of all regions had an R&D intensity below the EU average
The regional distribution of R&D expenditure underlines the significance of clusters of scientific and technological excellence. Indeed, the skewed nature of R&D activity was such that 30 NUTS level 2 regions (out of 194 for which data are available) accounted for more than two thirds (68.5 %) of the EU’s intramural R&D expenditure in 2020. Note the information for Belgium and the Netherlands relates to NUTS level 1 regions, while only national data are available for Ireland and France (as well as Switzerland and Türkiye) and that these different territorial levels are included in the analyses presented. The inclusion of these less detailed data – particularly for France – contributes to the skewed nature of R&D activity. In 2020, there were 19 regions across the EU which recorded in excess of €4.0 billion of R&D expenditure. Leaving aside the national data for France, the two regions with the highest levels of R&D expenditure were both located in Germany (2019 data): Stuttgart (€16.5 billion) and Oberbayern (€12.6 billion).
R&D intensity is frequently used as a measure to determine an economy’s creative/innovative capacity. It is the ratio of R&D expenditure to gross domestic product (GDP). Despite modest annual increases over most of the last decade, R&D intensity in the EU in recent years remained below its long-established target of 3.00 %. It stood at 2.22 % in 2019 and jumped to 2.30 % in 2020 (reflecting a larger downturn in GDP associated with the COVID-19 crisis than the above-mentioned decrease in R&D expenditure). In 2021, R&D intensity fell back to 2.26 %, reflecting faster growth for GDP than for R&D expenditure.
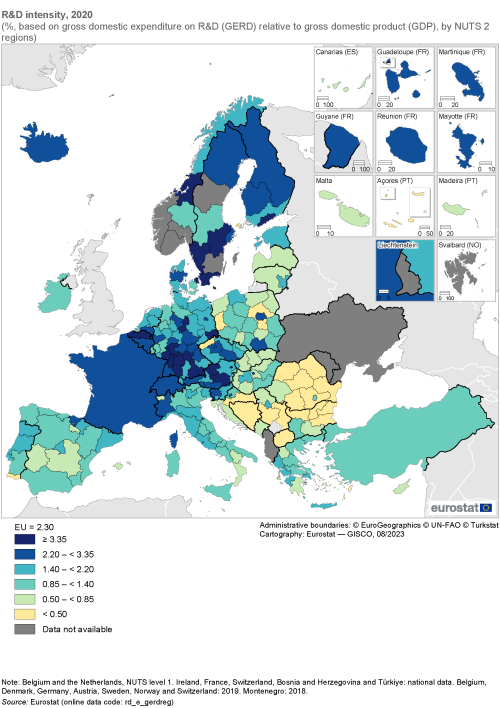
An analysis of the regional distribution of R&D intensity is less influenced than the analysis of R&D expenditure by the use of NUTS level 1 and national data for some EU Member States. However, the regional distribution of R&D intensity was also heavily skewed: less than one quarter (46 out of 194) of all regions had a ratio equal to or above the EU average of 2.30 % in 2020. There were 18 regions that recorded ratios of at least 3.35 % – as shown by the darkest shade of blue in Map 1. They were concentrated in Germany (nine regions), while the remainder were located in Austria and Sweden (both three regions), along with single regions from each of Belgium (NUTS level 1), Denmark and Finland. Within this group of 18 there were three capital regions, namely Hovedstaden in Denmark, Helsinki-Uusimaa in Finland and Wien in Austria. Note that the latest data available for this group of 18 regions relates to 2019, except for Helsinki-Uusimaa (2020 data).
The four highest ratios for R&D intensity were recorded in Germany (2019 data): a peak of 7.79 % was observed in Braunschweig, followed by Stuttgart (7.33 %), Karlsruhe (5.33 %) and Tübingen (5.20 %). These regions are characterised by clusters of innovative automotive manufacturers, engineering and component suppliers, as well as companies specialising in bio and nanotechnologies and artificial intelligence. For example, the Braunschweig region includes Wolfsburg (which is headquarters to the Volkswagen Group), the Stuttgart region is home, among others, to the headquarters of Bosch, Mercedes-Benz and Porsche, while Tübingen has research institutes attached to its university, the Max Planck Institute and technology parks specialising in, among other fields, bio- and nanotechnologies and artificial intelligence. There were two other regions in the EU where R&D intensity was higher than 5.00 %: Steiermark (5.15 %; 2019 data) in Austria, and Västsverige (5.10 %; 2019 data) in Sweden.
At the other end of the scale, there were 18 regions in the EU where R&D intensity was less than 0.50 % (they are shown in a yellow shade). This group was concentrated in eastern EU Member States: Romania (six regions), Bulgaria (four regions), Poland (two regions), Czechia and Croatia (single regions). It also included two regions from Portugal, as well as a single region in each of Greece and Finland. Many of these regions with very low R&D intensity were islands or rural regions.
(%, based on gross domestic expenditure on R&D (GERD) relative to gross domestic product (GDP), by NUTS 2 regions)
Source: Eurostat (rd_e_gerdreg)
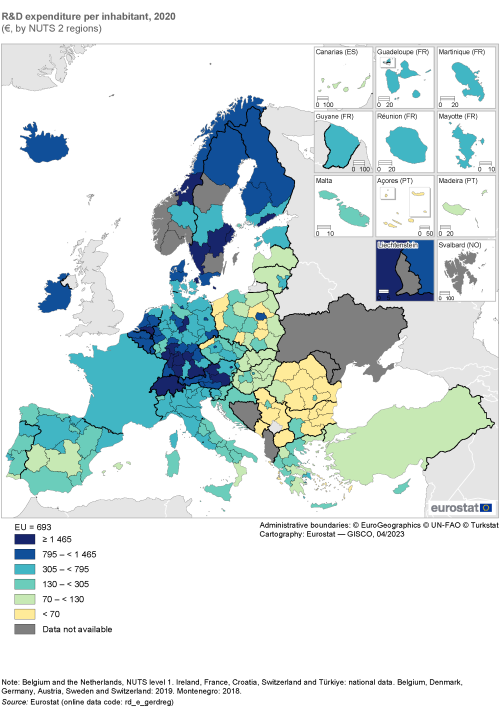
R&D expenditure in the EU averaged €693 per inhabitant
An alternative measure for the regional importance of R&D expenditure is given by the ratio of expenditure to the population size. In 2019, R&D expenditure across the EU averaged €699 per inhabitant. With the onset of the COVID-19 crisis, it fell slightly to €693 per inhabitant in 2020, before rebounding the following year to €735 per inhabitant.
There were 19 regions with a ratio of at least €1 465 of R&D expenditure per inhabitant (as shown by the darkest shade of blue in Map 2); note the data presented in this section for Belgium and the Netherlands relate to NUTS level 1 regions, while only national data are available for Ireland, France and Croatia (as well as Switzerland and Türkiye). These regions with high ratios were concentrated in Germany (nine regions), with others located in Austria and Sweden (both three regions), and single regions from each of Belgium (NUTS level 1), Denmark, the Netherlands (NUTS level 1) and Finland. Many of the regions with high R&D expenditure per inhabitant were also present among the group of regions that recorded the highest levels of R&D intensity. Stuttgart (€3 972 per inhabitant) and Braunschweig (€3 902 per inhabitant) in Germany (2019 data) had the highest ratios of R&D expenditure per inhabitant (as was the case for R&D intensity – see above). Stockholm (the Swedish capital region), Région de Bruxelles-Capitale / Brussels Hoofdstedelijk Gewest (the Belgian capital region; NUTS level 1), Bremen (Germany) and Zuid-Nederland (the Netherlands; NUTS level 1) were the only regions that featured in the group of regions with high R&D expenditure per inhabitant but did not feature among those regions with the highest ratios of R&D intensity. Note that the latest data available for this group of 19 regions relates to 2019, other than for regions in the Netherlands and Finland (both 2020 data).
In 2020, R&D expenditure per inhabitant was lower than the EU average in every region of Bulgaria, Greece, Spain, Lithuania, Portugal, Romania, Slovenia and Slovakia, as well as all but one of the regions in Czechia, Italy, Hungary and Poland (the exceptions being their capital regions, except for Italy where it was Emilia-Romagna). R&D expenditure per inhabitant was also lower than the EU average in Estonia, Cyprus, Latvia and Malta, where regional data concern a single region and in Croatia (national data). There were 20 regions where R&D expenditure per inhabitant was less than €70 (as shown by the yellow shade in Map 2). They were concentrated in Romania (six regions), Bulgaria (five regions) and Poland (also five regions), while this group also included two regions from Greece and single regions from each of Czechia and Portugal. The two lowest ratios were recorded in Romania: Sud-Vest Oltenia (€9 per inhabitant) and Sud-Est (€8 per inhabitant). The skewed nature of R&D expenditure can be underlined by the fact that R&D expenditure per inhabitant in Stuttgart was almost 500 times as high as it was in Sud-Est.
Human resources in science and technology
Human resources in science and technology (HRST) are defined as persons who fulfil at least one of the following two criteria:
As such, the concept of HRST can relate to a person’s level of education, irrespective of their actual professional occupation. By contrast, the concept of R&D personnel relates specifically to occupations, namely if a person is directly engaged in R&D (creative and systematic work undertaken to increase the stock of knowledge or to devise new applications of existing knowledge). Therefore, the criteria for HRST are broader, with the number of HRST considerably higher than the number of R&D personnel.
In 2022, there were 119.8 million persons in the EU classified as HRST; among these, there were 95.4 million persons who met the educational criterion, 75.9 million who met the occupational criterion, and 51.5 million who met both the educational and occupational criteria (this latter group constitutes what is often referred to as the HRST ‘core’ group).
Map 3 shows the distribution of HRST across NUTS level 2 regions. In 2022, the highest counts of HRST were, unsurprisingly, recorded in some of the most populous regions of the EU: Ile-de-France (4.8 million HRST) and Rhône-Alpes (2.2 million) in France; Comunidad de Madrid (2.4 million), Cataluña (2.3 million) and Andalucía (2.1 million) in Spain; and Lombardia in Italy (2.1 million). These were the only regions in the EU to record in excess of 2.0 million HRST.
There were 24 regions where more than one million persons were classified as HRST (as shown by the largest circles in Map 3). Apart from the six regions mentioned above, the remaining 18 regions in this group were principally located in Germany (six regions) and France (four regions), although it also included regions in six other Member States. As well as the capital regions of France and Spain (mentioned above), there were six additional capital regions – those of Germany, Italy, Poland, the Netherlands, Greece and Sweden – where more than one million persons were classified as HRST.
Map 3 also shows the share of HRST in the labour force (sometimes referred to as the economically active population). In 2022, the share of HRST in the EU labour force was 47.5 %. Unlike other science and technology indicators, the regional distribution for this indicator was not highly skewed. Rather, there was a fairly equal split in the number of regions with shares above (111 regions or 46.1 % of the total) and below (130 regions) the EU average.
In 2022, there were 25 NUTS level 2 regions in the EU where HRST accounted for at least 58.0 % of the labour force (as shown by the darkest shade of blue in Map 3). These regions were widely dispersed across the EU territory, with their highest concentration in Belgium (four regions), the Netherlands and Sweden (both three regions), Germany and France (both two regions); there were 11 EU Member States where a single region met this criterion. HRST accounted for a particularly high share (71.2 %) of the labour force in Prov. Brabant Wallon in Belgium, while the capital regions of Warszawski stołeczny (Poland), Stockholm (Sweden), Sostinės regionas (Lithuania), Budapest (Hungary), Praha (Czechia) and Luxembourg (a single region at this level of detail) were the only other NUTS level 2 regions where HRST accounted for more than two thirds of the labour force.
The group of 25 regions with the highest shares of HRST in their respective labour forces were generally concentrated in capital regions and other urban regions. Prov. Brabant Wallon in Belgium, Utrecht in the Netherlands and País Vasco in Spain were atypical insofar as they attracted a higher share of HRST to their regional labour forces than their capital regions. The non-capital urban regions in this group were principally located in western EU Member States, the only exceptions being País Vasco (in Spain), Sydsverige and Västsverige (both in Sweden). To a large degree – given that a majority of HRST meet the education rather than occupation criterion – the regional distribution of HRST in the labour force that is shown in Map 3 closely resembles the distribution of people with a tertiary level of educational attainment (for more details, see Map 5 of the chapter on education and training). Regions with high shares of HRST in their labour force are likely to experience a number of benefits, such as: higher productivity, higher wage levels and clusters of research and technology activity. Factors such as these, in turn, are likely to reinforce their attractiveness to graduates and to (new) businesses, thereby generating spillover effects.
At the other end of the range, there were 26 regions in the EU where the share of HRST in the labour force was less than 32.0 % (as shown by the yellow shade). Generally, they were characterised as rural and peripheral regions and they were all in eastern and southern EU Member States. Ionia Nisia in Greece (23.9 %), together with three regions from Romania – Sud-Est (24.3 %), Sud-Muntenia (23.6 %) and Nord-Est (21.7 %) – had the lowest regional shares of HRST in the labour force; they were the only regions where HRST accounted for less than one quarter of the labour force.
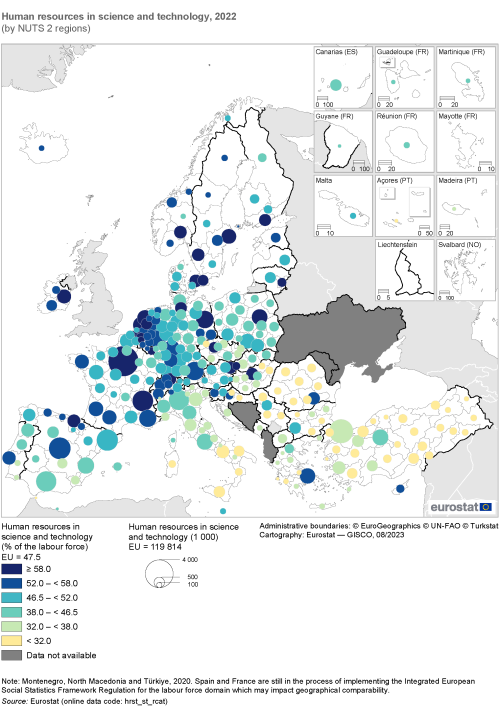
(by NUTS 2 regions)
Source: Eurostat (hrst_st_rcat)
R&D personnel and researchers
R&D personnel consists of all individuals employed directly in the field of R&D. Included are not only researchers, but also technicians and equivalent staff as well as supporting staff (such as managers, administrators and clerical staff). R&D personnel are employed in public and private sectors (in business enterprises, government, higher education and private non-profit organisations) to create new knowledge, products, processes and methods, as well as to manage and support the projects concerned.
Across the EU in 2020, 3.0 million people in full-time equivalents (FTEs) were categorised as R&D personnel; this figure rose to 3.1 million a year later. To put these figures on the size of the R&D workforce into context, R&D personnel (measured in FTEs) accounted for a 1.56 % share of the total number of persons employed in the EU in 2020 and 1.62 % a year later. As with many science and technology indicators, the regional distribution of R&D personnel was highly skewed. In 2020 (the latest reference year for regional statistics), there were 60 NUTS level 2 regions in the EU (out of 191 regions for which data are available) that had shares equal to or above the EU average, leaving more than two thirds (or 68.6 %) of all regions recording shares below the EU average. Note the data presented in this section for Belgium and the Netherlands relate to NUTS level 1 regions, while only national data are available for Ireland, France and Croatia (as well as Switzerland and Türkiye) and that these different territorial levels are included in the counts of regions.
In 2020, there were 20 EU regions where R&D personnel (measured in FTEs) accounted for at least 2.20 % of the total number of persons employed; they are shown with the darkest shade of blue in Map 4. They were spread across 13 different EU Member States, with the highest concentration recorded in Germany (six regions; 2019 data). Half of this group of 20 regions was capital regions, while the remaining four regions outside of Germany included Steiermark in Austria (2019 data), Västsverige in Sweden (2019 data), Zuid-Nederland in the Netherlands (NUTS level 1) and Emilia-Romagna in Italy. At the top end of the distribution, the Czech capital region of Praha (4.15 %), the German region of Braunschweig (4.03 %; 2019 data), the Hungarian capital region of Budapest (4.01 %) and the Danish capital region of Hovedstaden (4.00 %; 2019 data) were the only regions in the EU where R&D personnel accounted for at least 4.00 % of the total number of persons employed in 2020.
By contrast, there were 22 regions across the EU where the share of R&D personnel (measured in FTEs) in the total number of persons employed was less than 0.45 % in 2020 (as shown by the yellow shade in Map 4). This group was concentrated in eastern EU Member States, principally across Romania (seven out of eight regions, the only exception being the capital region of Bucureşti-Ilfov) and Poland (five regions). At the lower end of the distribution, Mazowiecki regionalny in Poland (which surrounds the capital region of Warszawski stołeczny; 0.19 %), and two Romanian regions – Sud-Est (0.13 %) and Sud-Vest Oltenia (0.08 %) – were the only regions in the EU where the share of R&D personnel in the total number of persons employed was less than 0.20 %.
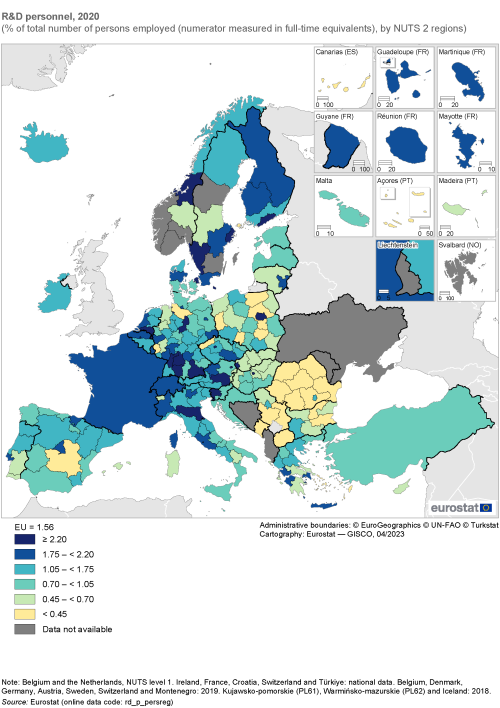
(% of total number of persons employed (numerator measured in full-time equivalents), by NUTS 2 regions)
Source: Eurostat (rd_p_persreg)
There were 2.8 million researchers in the EU, equivalent to 1.35 % of the labour force
Researchers are persons engaged in R&D activities. They are defined as ‘… professionals engaged in the conception or creation of new knowledge, products, processes, methods and systems, as well as in the management of the projects concerned … They conduct research and improve or develop concepts, theories, models, techniques instrumentation, software or operational methods’.
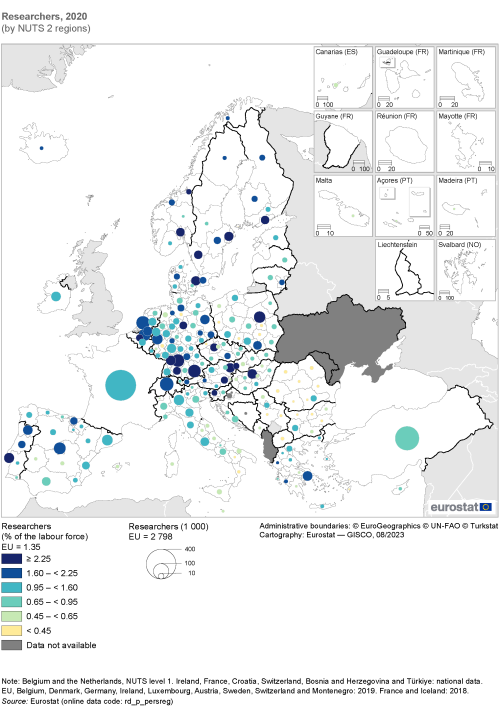
In 2019, the total number of researchers in the EU was 2.8 million; note this figure is a head count (data are not expressed in terms of FTEs). Map 5 shows the regional distribution of researchers across NUTS level 2 regions, detailing the total number of researchers as well as the relative share of researchers in the labour force. Note the data presented in this section for Belgium and the Netherlands relate to NUTS level 1, while only national data are available for Ireland, France and Croatia (as well as Switzerland and Türkiye).
In 2020 – the latest reference year for which regional statistics on researchers are available in most EU Member States – the highest numbers of researchers were, unsurprisingly, recorded in some of the most populous regions of the EU. The distribution of researchers was relatively concentrated in a few clusters, principally in those regions where R&D intensity was high. The main difference was that the number of researchers tended to be somewhat more concentrated in regions characterised as having higher education establishments and research institutes (often capital city regions). The skewed nature of research activity was such that 23 regions (out of 190 for which data are available) accounted for half of all researchers in the EU; note this calculation includes less detailed data for France and Ireland (for which only national data are available), as well as West-Nederland and Zuid-Nederland in the Netherlands and Vlaams Gewest in Belgium (NUTS level 1). By contrast, at the other end of the distribution there were 80 regions where the number of researchers was less than 5 000.
There were 19 regions that had at least 33 500 researchers in 2020 (as shown by the largest circles in Map 5). This group was concentrated in Germany (five regions), with the remaining 14 regions spread across 12 different EU Member States; Spain and Portugal both had two regions. These 19 regions with a relatively high number of researchers were concentrated in capital regions (of which there were eight) and other urban regions. The latter included West-Nederland in the Netherlands (NUTS level 1), Oberbayern, Stuttgart, Köln and Karlsruhe in Germany (2019 data), Vlaams Gewest in Belgium (NUTS level 1; 2019 data) and Lombardia in Italy; each of these was atypical insofar as they reported a higher number of researchers than in their capital regions.
Leaving aside France – for which only national data are available (430 000 researchers; 2018 data) – the highest regional count of researchers was observed in the Dutch region of West-Nederland (NUTS level 1) with 74 800 researchers in 2020. There were five other regions which reported upwards of 50 000 researchers: Oberbayern and Stuttgart in Germany (both 2019 data), the Spanish capital region of Comunidad de Madrid, Vlaams Gewest in Belgium (NUTS level 1; 2019 data) and the Polish capital region of Warszawski stołeczny.
In 2019, researchers accounted for 1.35 % of the EU labour force. By normalising the data –in other words, expressing the number of researchers relative to the size of the labour force – it is possible to reduce the influence of those territories for which only national or NUTS level 1 data are available. There were 18 regions in the EU where the share of researchers in the labour force was at least 2.25 % in 2020 (as shown by the darkest shade of blue in Map 5); they were widely distributed, principally across Nordic, eastern and western EU Member States.
Looking in more detail, the highest shares of researchers in the labour force were concentrated in capital regions. In 2020, 9 out of the 10 regions with the highest shares were capital regions. A peak of 4.16 % was recorded in the Hungarian capital region of Budapest, with the next highest proportions observed in the Slovak capital region of Bratislavský kraj (3.91 %) and Austrian capital region of Wien (3.62 %; 2019 data). This group of 10 also included the capital regions of Poland, Czechia, Denmark (2019 data), Belgium (NUTS level 1; 2019 data), Finland and Portugal. The only non-capital region was Steiermark in Austria, where the share of researchers in the labour force stood at 3.03 % (2019 data); Steiermark has high level of research activity in disciplines such as mechanical and automotive engineering, metallurgy and materials science, or industrial chemistry. The high concentration of research activity in EU capital regions may be attributed to several reinforcing factors including, among others: a concentration of research institutions, universities, and scientific organisations; state-of-the-art research infrastructure and equipment; high levels of funding for research and innovation; collaborative and networking opportunities; a broad range of job opportunities for researchers.
In 2020, there were 21 regions across the EU where the share of researchers in the labour force was less than 0.45 % (these regions are shaded in yellow in Map 5). They were principally concentrated in eastern EU Member States, in particular across Romania (seven regions; the only exception was the capital region of Bucureşti-Ilfov), but also in Poland (four regions), Bulgaria (three regions) and Czechia (a single region). This group also included the southern Italian regions of Basilicata and Calabria, the German regions of Koblenz and Lüneburg (both 2019 data), the Greek island region of Notio Aigaio and the Finnish archipelago of Åland. The lowest shares – where researchers accounted for less than 0.20 % of the labour force – were recorded in the Polish region of Mazowiecki regionalny and the Romanian regions of Centru, Sud-Est, Sud-Vest Oltenia and Sud-Muntenia.
The number of researchers across the EU has steadily increased over time. Despite the impact of the COVID-19 crisis, there were 1.8 % more researchers in 2020 than the year before. This was followed by a considerably faster growth rate in 2021, as the number of EU researchers increased 6.2 %.
The total number of researchers in the EU stood at 1.89 million full-time equivalents (FTEs) in 2020 and rose to 2.0 million FTEs a year later. An analysis of researchers can be extended by introducing an additional dimension to the dataset, the sector of performance. Statistics are compiled for four institutional sectors: business enterprises, government, higher education and private non-profit. In 2021 (note that 2020 is the latest reference year for which regional statistics are generally available in most EU Member States), the business enterprise sector accounted for 56.3 % (55.3 % in 2020) of all researchers employed in the EU. The higher education sector had the next highest share at 31.9 % (32.7 % in 2020), followed by the government sector with 11.0 % (11.3 % in 2020).
Figure 1 shows that the relative importance of these different sectors varied considerably across EU regions. Most of the regions reporting relatively high shares of researchers working within the business enterprise sector were located in western and Nordic EU Member States. The number of researchers (measured in FTEs) in the business enterprise sector as a share of the total number of persons employed peaked at 2.29 % in the German region of Stuttgart (2019 data). The next highest shares – within the range of 1.57–1.85 % – were recorded in the Hungarian capital region of Budapest (2020 data), the Danish capital region of Hovedstaden (2019 data) and the Swedish region of Västsverige (which includes the city of Gothenburg; 2019 data).
In 2020, the Czech capital region of Praha reported the highest share of researchers (measured in FTEs) working in the government sector, equivalent to 0.77 % of its total number of persons employed. Relatively high shares were also recorded in the Slovak capital region of Bratislavský kraj (0.70 %) and the Hungarian capital region of Budapest (0.60 %).
In contrast to the other sectors of performance, there was a greater degree of regional variation for the number of researchers employed within the higher education sector. In 2020, the highest share was recorded in the Slovak capital region of Bratislavský kraj, where researchers (measured in FTEs) in the higher education sector as a share of the total number of persons employed peaked at 1.34 %; this was more than four times as high as the EU average. The Greek region of Dytiki Elláda had the second highest share (1.25 %) and was the only other region in the EU where researchers in the government sector accounted for more than 1.00 % of the total number of persons employed.
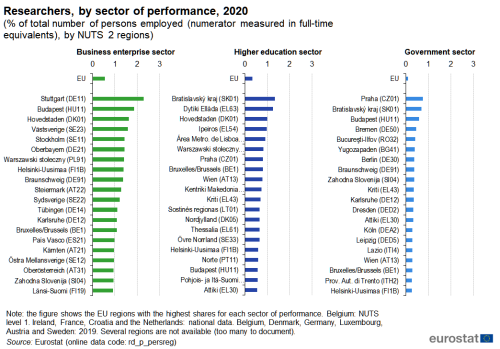
(% of total number of persons employed (numerator measured in full-time equivalents), by NUTS 2 regions)
Source: Eurostat (rd_p_persreg)
Focus on human resources in science and technology
The final part of this chapter provides a regional analysis of human resources in science and technology by sex. The EU actively promotes gender equality in the fields of science, technology, engineering, and mathematics, through a broad range of policies/initiatives, including gender equality plans within the EU’s research framework programme called Horizon Europe. The European research area and the European Institute for Gender Equality both promote initiatives such as gender mainstreaming, training programmes, and networking opportunities for female scientists and engineers.
In 2022, there were 17.8 million scientists and engineers in the EU; their number increased 3.6 % between 2021 and 2022. A majority (59.1 %) of the scientists and engineers in the EU were male.
Figure 2 shows the share of scientists and engineers in the female/male labour force. In 2022, female scientists and engineers in the EU accounted for 7.3 % of the female labour force; the share among males was higher, at 9.1 %. Two Swedish regions had the highest shares of female scientists and engineers in the female labour force – Östra Sverige (14.6 %) and Södra Sverige (12.8 %). There were nine other regions across the EU that recorded double-digit shares for female scientists and engineers. By contrast, the lowest shares were recorded in the Italian region of Isole (3.2 %) and two Hungarian regions – Dunántúl and Alföld és Észak (3.2 % and 3.1 %, respectively).
A similar analysis for male scientists and engineers reveals that there were 31 NUTS level 1 regions where the share of male scientists and engineers in the male labour force was at least 10.0 %. In 2022, the highest shares were recorded in the German capital region of Berlin (17.2 %), Östra Sverige in Sweden (16.5 %) and Közép-Magyarország in Hungary (16.3 %). The lowest shares were recorded in the Italian regions of Sud and Isole (both 4.0 %) and the Bulgarian region of Severna i Yugoiztochna Bulgaria (3.5 %).
In 2022, scientists and engineers accounted for a higher proportion of the male rather than female labour force in 62 out of the 87 NUTS level 1 regions for which data are available. The biggest gender gap in favour of men was recorded in the Hungarian capital region of Közép-Magyarország, where the share of male scientists and engineers was 8.4 percentage points higher than the corresponding share for women. Relatively large gender gaps in favour of men were also observed in Manner-Suomi in Finland (7.4 points) and the German capital region of Berlin (6.8 points). By contrast, there were 23 NUTS level 1 regions where the share of scientists and engineers in the labour force was higher among women than men; as such, there were two regions in the EU – the Spanish capital region of Comunidad de Madrid and the Polish region of Makroregion południowo-zachodni – where the relative shares of men and women were equal. The largest gender gaps in favour of women were recorded in Poland: Makroregion wschodni and Makroregion centralny had gender gaps of 3.3 and 3.4 percentage points, respectively.
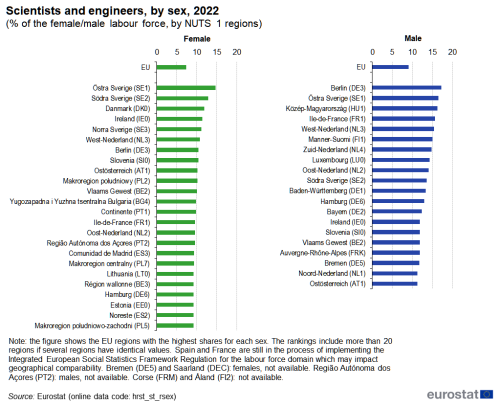
(% of the female/male labour force, by NUTS 1 regions)
Source: Eurostat (hrst_st_rsex)
There were 9.8 million people employed in high-technology sectors across the EU
High-technology sectors are considered key drivers of economic growth and productivity, and often provide well-paid employment opportunities. This final section highlights gender imbalances in high-technology sectors, defined here as high-technology manufacturing sectors (the manufacture of basic pharmaceutical products and pharmaceutical preparations; the manufacture of computer, electronic and optical products) and knowledge-intensive high-technology services (motion picture, video and television programme production, sound recording and music publishing activities; programming and broadcasting activities; telecommunications; computer programming, consultancy and related activities; information service activities; scientific research and development). The distinction between manufacturing and services is made due to the existence of two different methodologies. While R&D intensities are used to distinguish between high, medium-high, medium-low and low-technology manufacturing industries, for services the proportion of the workforce that has completed a tertiary education is used to distinguish between knowledge-intensive services and less knowledge-intensive services. The statistics presented on employment in high-technology sectors cover all persons (including support staff) who work in these enterprises, and as such will overstate the number of highly-qualified workers.
In 2022, there were 9.8 million people employed in high-technology sectors across the EU; men accounted for just over two thirds (67.2 %) of the total. There were 23 NUTS level 2 regions where at least 100 000 people were employed in high-technology sectors; these regions are shown by the largest circles in Map 6. In keeping with most science and technology indicators, they were concentrated in some of the largest capital/urban regions of the EU. This group contained 13 capital regions, including the French (Ile-de-France) and Spanish (Comunidad de Madrid) capital regions, where the highest numbers of people employed in high-technology sectors were observed (420 000 and 289 000, respectively). There were three other regions in the EU which recorded more than 200 000 persons employed in high-technology sectors: Oberbayern in southern Germany, Lombardia in northern Italy and Cataluña in eastern Spain.
To give some idea of the skewed nature of the distribution, the 23 regions that employed at least 100 000 people in their high-technology sectors together employed 3.9 million persons in 2022, equivalent to around two fifths (39.3 %) of the EU total. This was similar to the cumulative share of the 169 regions with the lowest numbers of persons employed in high-technology sectors. At the bottom end of the distribution, there were 24 regions in the EU where less than 7 500 persons were employed in high-technology sectors; these regions are shown by the smallest circles in Map 6. This group included five regions where less than 3 000 persons were employed in high-technology sectors, the southern Italian region of Molise, together with four Greek regions – Anatoliki Makedonia, Thraki; Peloponnisos; Ipeiros; and Sterea Elláda.
Women accounted for almost one third (32.8 %) of the total number of persons employed in the EU’s high-technology sectors in 2022. The female share of high-technology employment ranged across NUTS level 2 regions from a high of 50.2 % in the Hungarian region of Nyugat-Dunántúl down to 8.3 % in the Greek region of Thessalia. In fact, Nyugat-Dunántúl was the only region in the EU (at this level of detail) where there were more women than men employed in high-technology sectors. The next highest shares of female employment were recorded in the Italian region of Marche (48.6 %) and another Hungarian region, Észak-Magyarország (48.1 %).
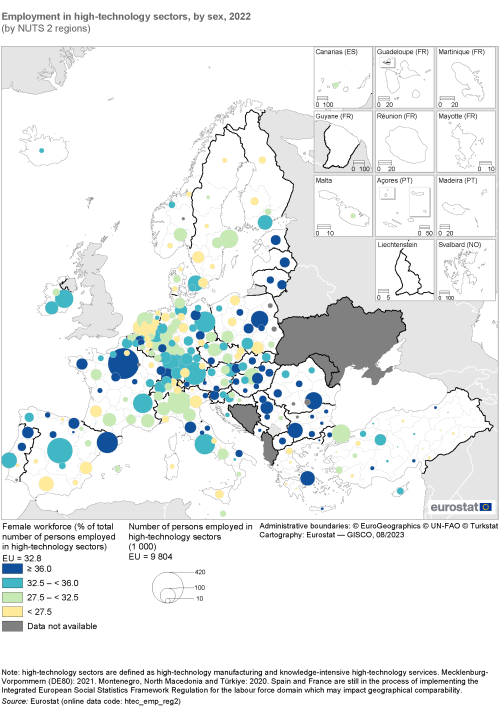
(by NUTS 2 regions)
Source: Eurostat (htec_emp_reg2)
Source data for figures and maps
Data sources
Starting from reference year 2021, regional business statistics on R&D expenditure and employment in R&D have a new legal basis – the EBS Regulation (Regulation (EU) 2019/2152 of the European Parliament and of the Council of 27 November 2019 on European business statistics). This provides the detailed rules concerning the production of European statistics on science and technology (for example, datasets, analyses, frequency or transmission timetable to be respected by the EU Member States). Prior to the 2021 reference year, Commission Regulation (EU) No 995/2012 of 26 October 2012 concerning the production and development of Community statistics on science and technology provided the legal basis for these statistics.
Note: some statistics that are used to analyse science and technology are compiled using data from other statistical domains within Eurostat or from a range of databases provided by other international organisations. For example, statistics on human resources in science and technology (HRST) are compiled annually based on microdata from the EU’s labour force survey (LFS).
The methodology for R&D statistics is laid down in the Frascati manual (OECD, 2015). It provides guidelines for collecting and reporting data on research and experimental development, with definitions of basic concepts and classifications for compiling R&D statistics.
The methodology for statistics on HRST is laid down in the Canberra manual (OECD, 1995), which lists all HRST concepts and provides definitions of human resources devoted to science and technology in terms of qualification (levels and fields of study) and occupation.
Indicator definitions
R&D expenditure and intensity
The basic measure of expenditures on research and development (R&D) concerns the intramural expenditures by statistical units. Included are all expenditures for R&D performed within a statistical unit or sector of the economy, regardless of the source of funds.
R&D intensity is defined as R&D expenditure relative to gross domestic product (GDP), expressed as a percentage.
High-technology sectors
Statistics on high-technology sectors comprise statistics on high-tech industry and knowledge-intensive services. Within this publication technological intensity is identified in terms of a sectoral approach. High-technology manufacturing is defined as NACE Divisions 21 and 26 (manufacture of basic pharmaceutical products and pharmaceutical preparations; manufacture of computer, electronic and optical products). High-tech knowledge-intensive services are defined as NACE Divisions 59–63 and 72 (motion picture, video and television programme production, sound recording and music publish activities; programming and broadcasting activities; telecommunications; computer programming, consultancy and related activities; information service activities; scientific research and development).
Human resources in science and technology (HRST)
HRST include people who fulfil at least one of the following conditions:
- successfully completed tertiary education (human resources in science and technology by level of education);
- are employed in a science and technology occupation where the above qualifications are normally required (human resources in science and technology by occupation).
R&D personnel
Statistics on R&D personnel are compiled using guidelines laid out in the Frascati manual (see above). R&D personnel include all persons employed directly within R&D, as well as persons supplying direct services (such as managers, administrative staff and clerical staff). For statistical purposes, indicators on R&D personnel are compiled as both head counts and as full-time equivalents (FTEs).
Researchers
A researcher is a professional engaged in the conception or creation of new knowledge. A researcher conducts research and improves or develops concepts, theories, models, techniques instrumentation, software or operational methods.
Scientists and engineers
Scientists and engineers refer to persons who, working in those capacities, use or create scientific knowledge and engineering and technological principles. In other words, persons with scientific or technological training who are engaged in professional work on science and technology activities, high-level administrators and personnel who direct the execution of S&T activities.
In the case of HRST (as covered in this chapter), scientists and engineers are people who conduct research, improve or develop concepts, theories and operational methods and/or apply scientific knowledge relating to fields which are covered by one of the following occupations defined in the International standard classification of occupations (ISCO-08):
- 21 Science and engineering professionals;
- 22 Health professionals;
- 25 Information and communications technology professionals.
Context
In A renewed European Agenda for Research and Innovation – Europe’s chance to shape its future (COM(2018) 306 final), the European Commission laid out plans to invest in research and development in order to invest in Europe’s future. Among other objectives, the agenda called for a stronger European research and innovation ecosystem, making Europe a frontrunner in market-creating innovation, while setting EU-wide research and innovation missions. It also proposed measures to invest in skills, while empowering European universities to become more entrepreneurial and interdisciplinary. The Agenda identified three different aspects for investment:
- scientific and technological research – with a focus on major societal and industrial challenges such as security, climate change, and the impact of an ageing population;
- to make the business environment more innovation-friendly and less risk-averse;
- to support EU inhabitants through what could be a fast and, for some, turbulent transition.
In much the same way as the industrial revolution triggered a paradigm shift, the dual challenges of climate change and the post-pandemic recovery are likely to lead to profound socioeconomic transformations. The European Commission’s Directorate-General for Research and Innovation has put forward a transformative vision for the future. Industry 5.0 seeks to build resilience within existing EU economic structures, while bringing about transformations based on sustainable, regenerative and circular production. The policy promotes economic development that works for people, adopting a human-centric approach to digital technologies (including artificial intelligence), together with programmes that support the up-skilling and re-skilling of the EU’s labour force (including digital skills). Given technological progress often displays strong agglomeration effects and new emerging value chains tend to concentrate in more innovative regions, Industry 5.0 promotes initiatives to rebalance regional performance, through investment in ‘de-industrialised’ regions and regions that have been ‘left-behind’.
Horizon Europe
The EU’s framework programmes for research have, since their launch in 1984, played a leading role in multidisciplinary research activities. In December 2020, political agreement was reached on the proposals for Horizon Europe, the EU’s 9th framework programme for research and innovation for 2021–2027; this programme has a total budget of €95.5 billion, the vast majority of which is allocated from the multiannual financial framework for 2021–2027. Horizon Europe’s first strategic plan covers the period from 2021–2024. It is based on four strategic orientations:
- leading the development of key digital, enabling and emerging technologies, sectors and value chains;
- restoring Europe’s ecosystems and biodiversity, and managing sustainably natural resources;
- making Europe the first digitally enabled circular, climate-neutral and sustainable economy;
- creating a more resilient, inclusive and democratic European society.
Within Horizon Europe, five European mission areas have been identified with the aim of increasing the effectiveness of funding by pursuing clearly defined targets:
- adaptation to climate change including societal transformation;
- cancer;
- climate-neutral and smart cities;
- healthy oceans, seas, coastal and inland waters;
- soil health and food.
European research area (ERA)
The European research area (ERA) has the ambition of creating a single, borderless market for research, innovation and technology across the EU. It was launched in 2000 and is designed to help EU Member States be more effective together, by strongly aligning their research policies and programmes. The free circulation of researchers and knowledge enables: better cross-border cooperation; building of critical mass; continent-wide competition.
During 2018, a process to revitalise the ERA began. In September 2020, the European Commission published a communication on A new ERA for Research and Innovation (COM(2020) 628 final). This highlighted that the EU faced several challenges, aggravated by the COVID-19 crisis, and that the ERA had a key role to play in addressing these challenges. It noted that, although the EU is still a global leader in research and innovation, its performance has stagnated in recent years. Some other countries, particularly from Asia, have increased in importance in terms of research and innovation and more broadly in their use of technology.
Drawing on the lessons from the COVID-19 crisis, the communication proposed that the ERA needed to be strengthened and research and innovation reinforced. Underlying these goals are not only the issues of prosperity and economic competitiveness but also the EU’s autonomy. The communication reaffirmed a commitment to the ERA and proposed a ‘new approach in order to accelerate Europe’s green and digital transformation, strengthen Europe’s resilience and preparedness to face future crises, and to support Europe’s competitive edge in the global race for knowledge’.
The European Research Area Policy Agenda 2022–2024 identifies four priority areas that are composed of 20 different actions:
- deepening a truly functioning internal market for knowledge;
- taking-up together the challenges posed by the twin green and digital transition, and increasing society’s participation in the ERA;
- amplifying access to research and innovation excellence across the EU;
- advancing concerted research and innovation investments and reforms.

