Retail trade developments
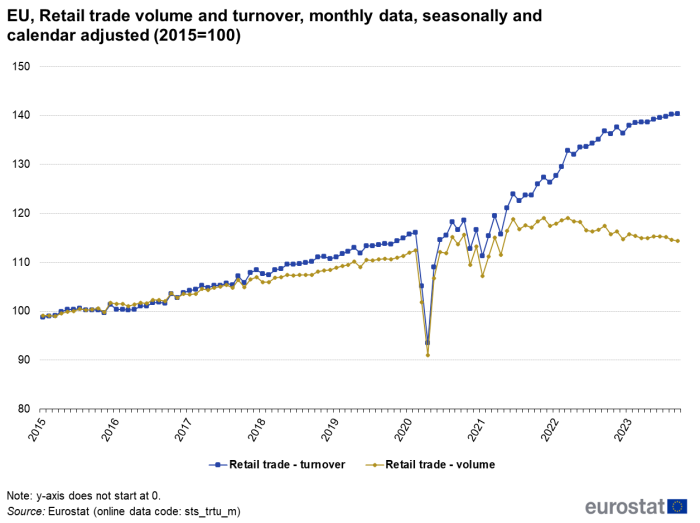
After the recovery from the financial and economic crisis in 2008/2009, the volume of retail trade in the EU increased slowly but relatively steadily (Figure 1). With the Covid-19 pandemic and national health prevention measures setting in during the spring of 2020, retail trade saw an unprecedented decline in March and April 2020. In the subsequent month, retail trade recovered almost as quickly as it had fallen and in late summer of 2020, the pre-crisis level was already regained. In the last quarter of 2020 and the first quarter of 2021, the retail trade volume dropped again. The decreases were quite considerable but by far not as dramatic as during the first wave of the pandemic (see the special article on the impact of the COVID-19 crisis on EU retail trade).
Figure 1 not only shows the (real) volume of EU retail trade but also the (nominal) turnover indicator which combines both volume and price changes. A divergence of the graphs of the volume and turnover measure suggest a rising level of prices. In May/June 2021, the turnover index began to increase much more dynamically than the volume index as a result of increasing consumer prices. This development grew slightly less dynamically during the most recent months but still persisted. In September 2023, retail trade turnover increased by 0.1 % while the turnover volume dropped by 0.2%.
Turnover for retail and wholesale trade
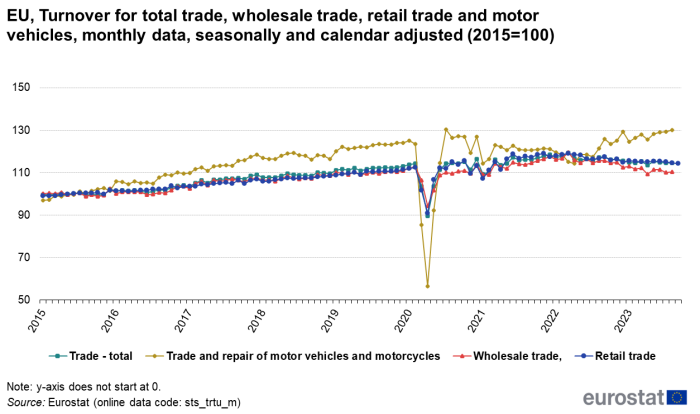
Deflated turnover data have recently become available for whole NACE Rev. 2 section G, which includes not only retail trade (NACE Rev. 2, division 47) but also wholesale trade (NACE Rev. 2, division 46) and the sale (wholesale and retail) and repair of motor vehicles (NACE Rev. 2, division 45). Figure 2 shows the development of these indicators for the EU. It becomes apparent that wholesale trade and the trade in motor vehicles reacted much more strongly during the Covid-19 crisis than the turnover of retail trade. However, the recovery of trade and repair of motor vehicles was also much more dynamic.
Since late summer 2020 and summer 2021, the volume of trade and repair of motor vehicles more or less stagnated while the turnover development of the other trade sectors was quite dynamic. Because of relatively high price increases, turnover in all sectors has grown quite strongly during the recent months.
During the last two years wholesale and retail trade slowly declined while the trade volume of motor vehicles steadily increased since summer 2022.
Source: Eurostat (sts_trtu_m)
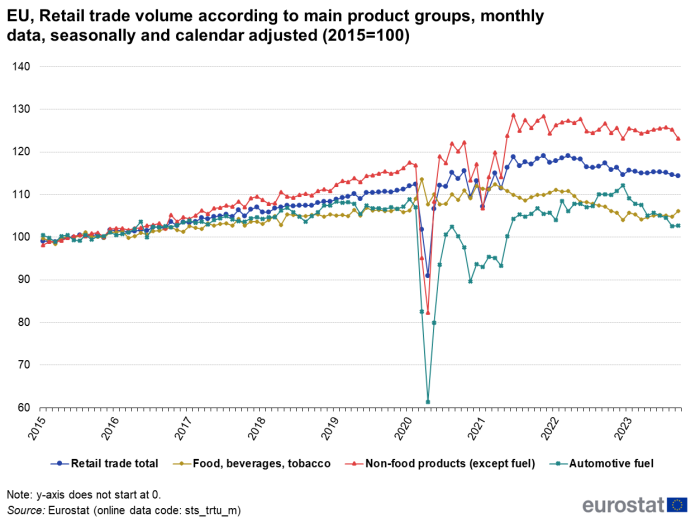
Figure 3 provides a breakdown of the retail trade volume for the three main product groups: non-food articles (excluding fuel); food, beverages and tobacco; and automotive fuel. The retail volume of food products (plus drinks and tobacco) reacted less strongly during the Covid-19 crisis than the trade volume of non-food products. However, both product groups generally developed in largely comparable ways.
The retail volume of fuel (sold in specialised stores, i.e. filling stations) has followed a less clearer trend. During the Covid-19 crisis, with lockdowns in many European countries, the sales of automotive fuel dropped by more than 40 %. The sales of fuel recovered during the summer and autumn however without regaining the pre-crisis levels.
Since summer 2021, the trade volume for non-food articles more or less stagnated, the trade volume for food declined slightly. Only the trade volume for fuel saw a moderate increase.
As a result of increasing price levels, the sales volume of all types of retail trades saw a decline during the last months.
Source: Eurostat (sts_trtu_m)
Development of the retail trade volume according to the type of sale
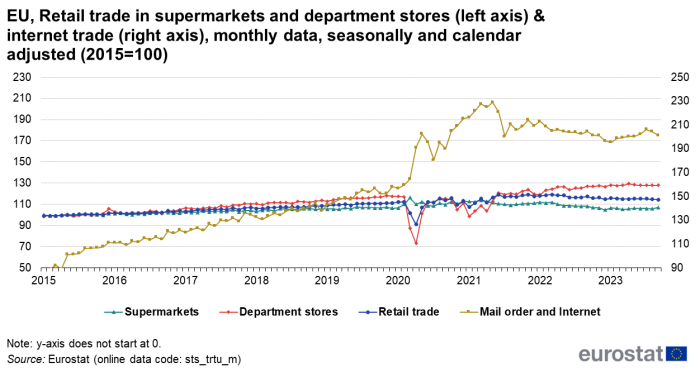
Figure 4 shows the development of the retail trade volume according to the type of sale (non-specialised stores with the sales of food and drinks prevailing, i.e. supermarkets, other non-specialised stores, i.e. department stores and internet sales). As can be seen, the sales via the internet have developed in a highly dynamic manner (starting from a low level in the early years). Note that the index for internet trade is measured on the right axis since internet trade and trade via other sales channels developed in quite a different manner.
Source: Eurostat (sts_trtu_m)
Development of the retail trade volume in the EU and third countries
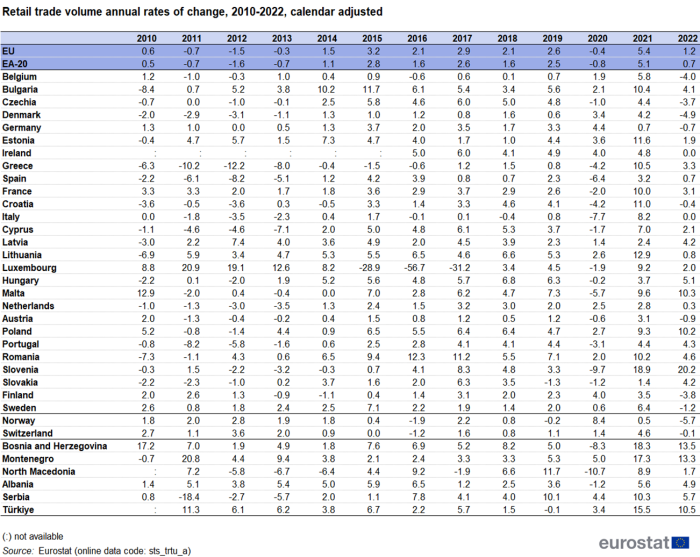
The retail trade volume in the EU Member States generally increased during the last decade, but the magnitude of the changes differ substantially (Table 1).
Source: Eurostat (sts_trtu_a)
During the years from 2010 to 2013, the overall development was mostly negative, however the decline was somewhat slower than in the years during the economic and financial crisis. Between 2014 and 2019, the recovery has been quite dynamic, with especially high increases observed in Bulgaria, Czechia, Cyprus, Lithuania, Hungary, Poland and Romania. The massive decrease in the figures for Luxembourg is due to the restructuring of a large multinational online retailer who moved its operations and turnover away from Luxembourg.
The annual rates for 2020 reflect the dramatic decreases that retail trade volume experienced in the spring of that year. Despite the recovery in subsequent months, the general development for the EU (-0.4 %) and the euro area (-0.8 %) were still negative in comparison with 2019. Exceptionally high negative rates of change were recorded in Spain, Italy, Malta, and Slovenia.
In 2021, all countries recorded positive growth rates. In 2022 growth was again much more subdued as a result of increasing prices.
Source data for tables and graphs
Data sources
Regulation (EU) No 2019/2152 of 27 November 2019 (European Business Statistics Regulation) foresees the regular production and transmission of a retailed trade index for all National Statistical Institutes.
The definition of retail trade volume as a deflated index of retail trade turnover is laid down in Commission Implementing Regulation (EU) No 2020/1197 of 30 July 2020. Retail trade turnover comprises the total invoiced by the statistical unit (observation unit) during the reference period. It includes all charges such as packaging and transport but excludes VAT and similar deductible taxes. (For more details see the glossary article on turnover in STS.)
The volume of retail trade is conceptually different from the volume of retail trade services. The latter indicator (not available at European level) does not relate to the sales as such but to the sales service provided by the retail businesses. Because of the methodological difficulties in construction a genuine sales service indicator the volume of retail trade is usually used as an approximation.
The latest results for the development of retail trade are published in monthly news releases by Eurostat.
Trade volume data are available on a monthly, quarterly and annual basis, in calendar adjusted and seasonally adjusted form (seasonal adjustment includes also calendar adjustment). All data are either available as indices or as growth rates.
Eurostat publishes aggregated data for the EU, for the euro areas, the EU Member States and some other European countries (see above).
The data in this article were calculated with 2015 as the base year (=100). As of March 2024 short-term statistics data use the base year 2021.
Context
Retail trade generates around 5 % of the total value added of the European economies. The index of deflated retail turnover (retail trade volume) is the key European indicator for the short-term development of retail trade. The indicator is also one of the ‘Principal European economic indicators (PEEI)‘ which are used to monitor and steer economic and monetary policies in the EU and in the euro area.

